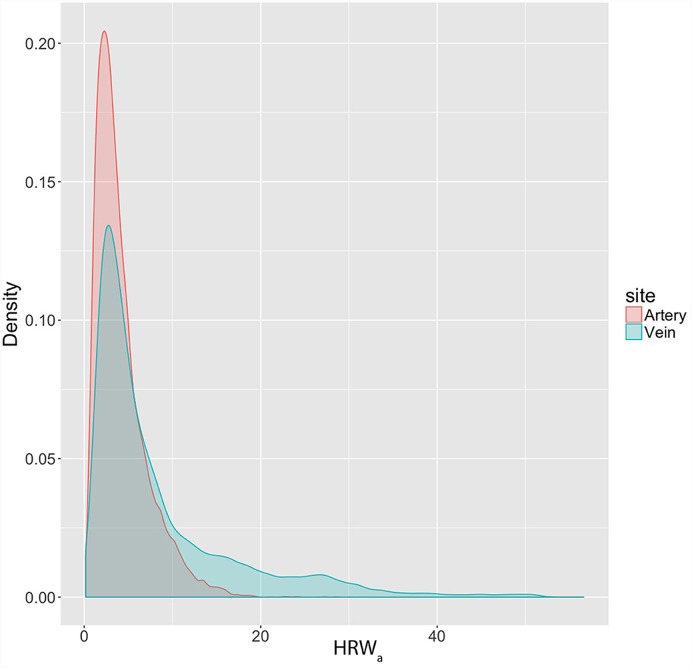
Fig 4. Density plot of the harmonic regression wave amplitude (HRWa) distribution in the retinal vascular system.
The distribution of the HRWa is non-normal, demonstrating a right skew in both retinal vascular systems. A larger skew in the HRWa distribution is demonstrated from values from the retinal veins compared to the retinal arteries.

