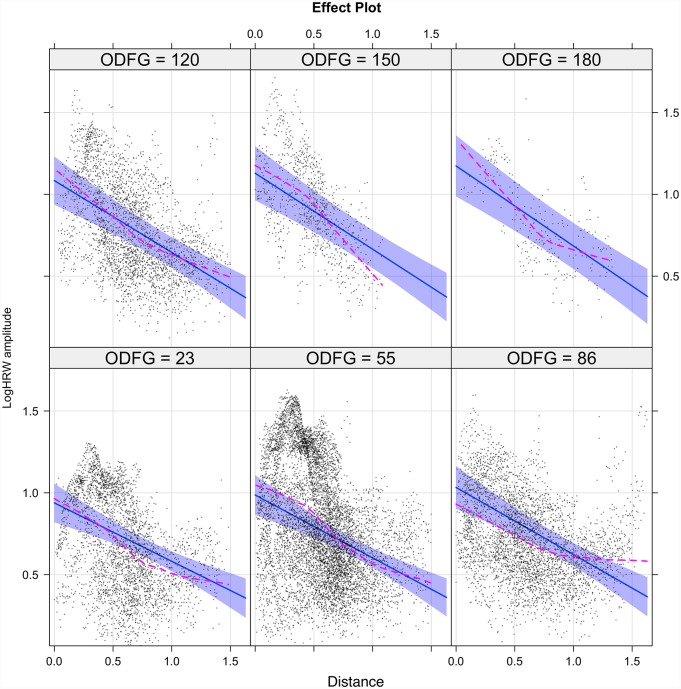
Fig 7. The interaction model of retinal venous pulse log harmonic regression waveform amplitude (logHRWa).
There was a positive correlation between HRWa attenuation and increasing ODF characterized by steepening of the slope of the regression line from -0.36 at 23g force to -0.49 at 180g force with the maximal change in logHRWa occurring at the center of the optic disc. Demonstrated are the 95% confidence intervals for the slope of the regression line. The sequence commences from the lower left to the upper right. The dashed line is the loess smoothed regression curve, superposition of both the curve and the regression line indicated a favorable model fit.

