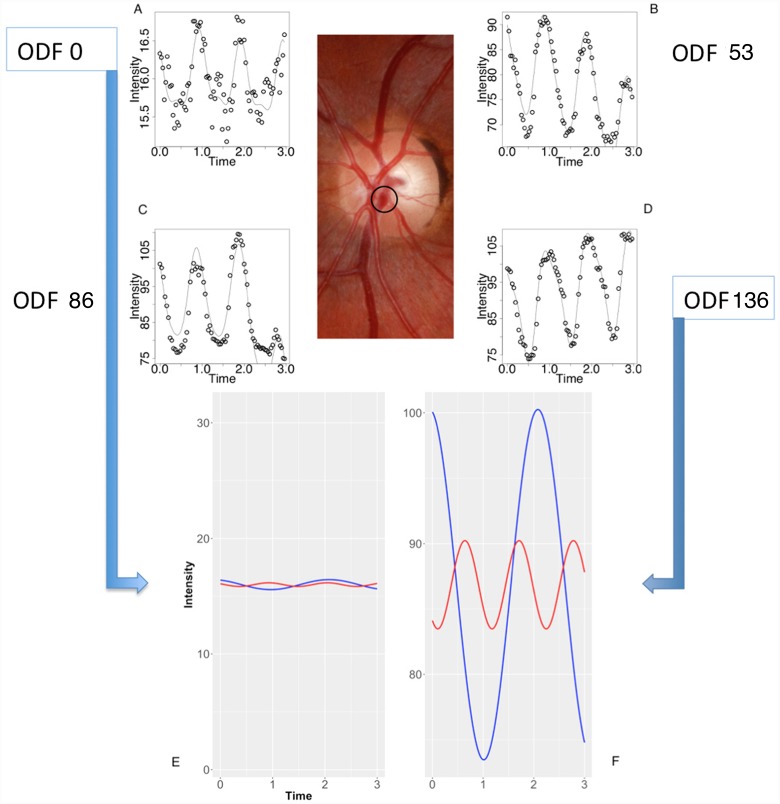
Fig 10. Composite image from the subject from Fig 9.
(A-D) The retinal venous pulse harmonic regression waveforms are represented graphically for ophthalmodynamometric force (ODF) 0, 53, 86 and 136 grams force. (E-F) The decomposed first (blue line) and second (red line) Fourier harmonic waves at ODF = 0 at (E) and ODF = 136 grams force at (F) calculated from the Fourier series equation for a single point as highlighted in the central color fundus image. Noted were the increase in the amplitude of the waveforms and the increase in the y-intercept of the regression line with increasing ODF.

