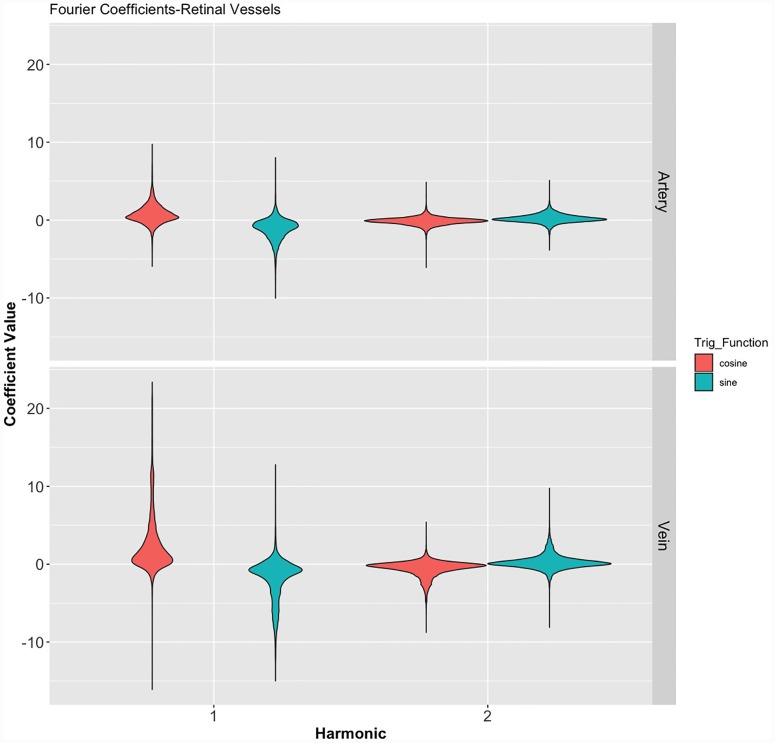
Fig 12. Violin plot of the distribution of the Fourier coefficients of the first and second Fourier harmonics in both vascular systems classified by trigonometric function.
Demonstrating the wider range for both the cosine (an) and sine (bn) coefficients in the veins, a narrower dispersion of values for the second Fourier harmonics and the disparate distribution, with displacement in the opposite direction across the axis of reference between the an and bn coefficients in both vascular systems. Numeric values of the figure are outlined in Table 2.

