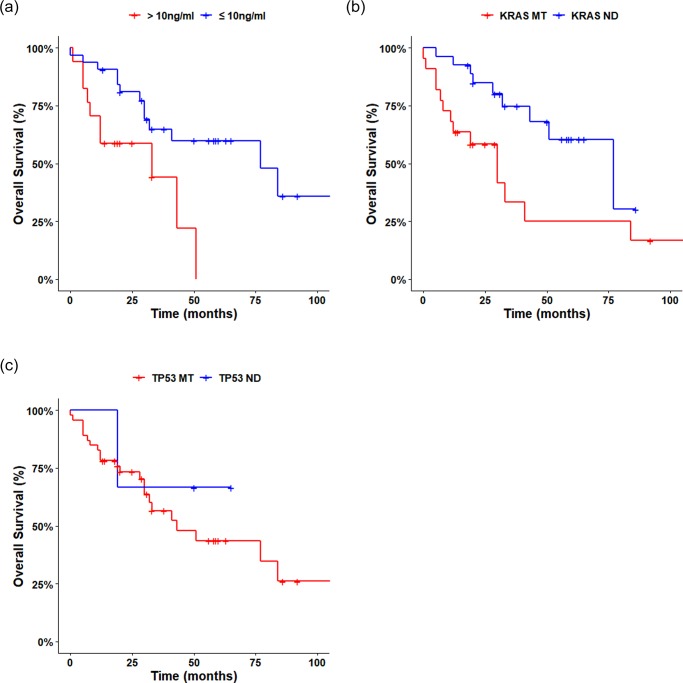
Fig 4. Survival of patients with actionable mutant fragments detected in plasma.
(A) Overall survival according to whether KRAS mutant fragments were or were not detected in baseline plasma cfDNA (n = 51, p<0.05). (B) Kaplan-Meier curves for overall survival in patients according to cfDNA concentration. Survival was worse in patients with higher cfDNA concentrations (>10 ng/mL, n = 17) than in those with lower cfDNA concentrations (≤10 ng/mL, n = 34) (log-rank test, p<0.05). (C) Kaplan-Meier curves for overall survival according to whether cfDNA TP53 mutants were detected. Overall survival was worse in patients with TP53 mutants, although this did not reach statistical significance (Log-rank test, p<0.1). cfDNA, cell-free DNA; MT, mutant detected; ND, mutant not detected.

