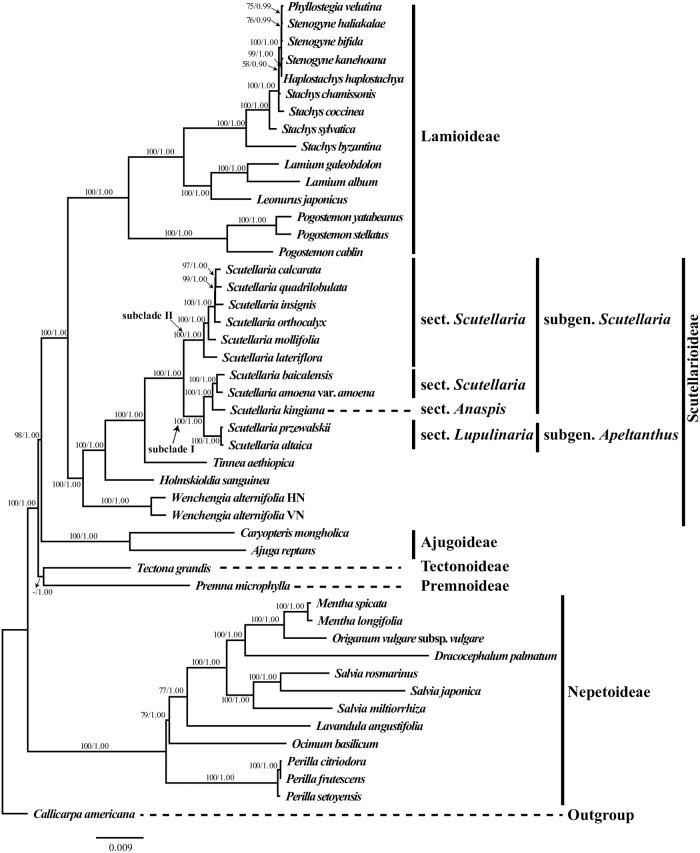
Fig 8. The best-score tree from maximum likelihood analysis of Scutellarioideae based on the complete plastome sequences.
Support values BS ≥ 50% or PP ≥ 0.90 are displayed on the branches follow the order MLBS/BIPP (“-” indicates a support value BS < 50%). Scale bar denotes the expected number of substitutions per site in maximum likelihood analysis.

