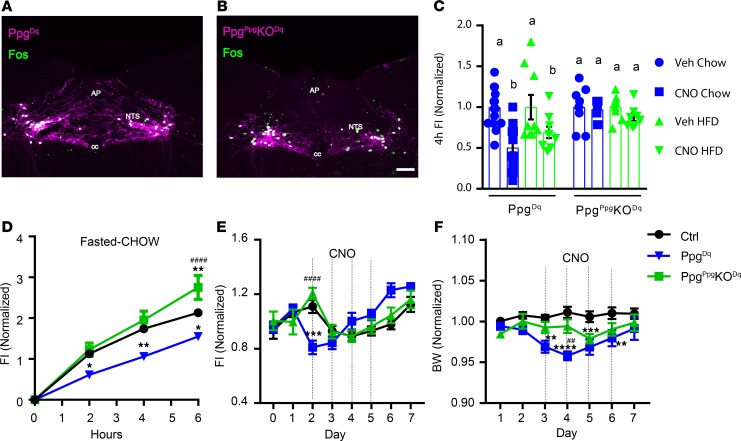
Figure 5. GLP1NTS neurons require Ppg to mediate the suppression of food intake.
Representative images of DREADD-hM3Dq-mCherry (purple) and FOS-IR (green) in CNO-treated (1 mg/kg i.p., 2 hours) Ppgcre (A) and PpgGLP1-NTSKO (PpgPpgKO) (B) mice subjected to the injection of AAVhM3Dq into the NTS (Ppg-Dq and PpgPpgKO-Dq mice, respectively). All panels are representative of n ≥ 3 similar images. AP, area postrema; cc, central canal. Scale bars: 150 μm. (C) Food intake in Ppg-Dq and PpgPpgKO-Dq mice during the first 4 hours of the dark cycle with chow or HFD, as indicated; n = 19 (chow) or 9 (HFD) in Ppg-Dq and n = 8 (both chow and HFD) in PpgPpgKO-Dq groups. (D) Food intake in vehicle-treated (Veh-treated) or CNO-treated (1 mg/kg i.p.) Ppg-Dq and PpgPpgKO-Dq mice following an overnight fast; n = 13, 5, and 8 in Veh, Ppg-Dq, and PpgPpgKO-Dq groups, respectively. (E and F) Daily food intake (E) and body weight (F) relative to baseline during multiday treatment with CNO (1 mg/kg, i.p., bid); n = 10, 8, and 8 in Veh, Ppg-Dq, and PpgPpgKO-Dq groups, respectively. Data are from both sexes; for data separated by sex, see Supplemental Figure 2, A–D. Data are shown as mean ± SEM. Two-way ANOVA with Sidak’s multiple comparisons test was performed for chow and HCD conditions (separately) in C. Two-way ANOVA with Tukey’s multiple comparisons test was performed for D–F. Different letters indicate difference (P < 0.05) in C. (D–F) *P < 0.05, **P < 0.01, ***P < 0.001, ****P < 0.0001 versus Veh. ##P < 0.01, ####P < 0.0001 for Ppg-Dq versus PpgPpgKO-Dq.

