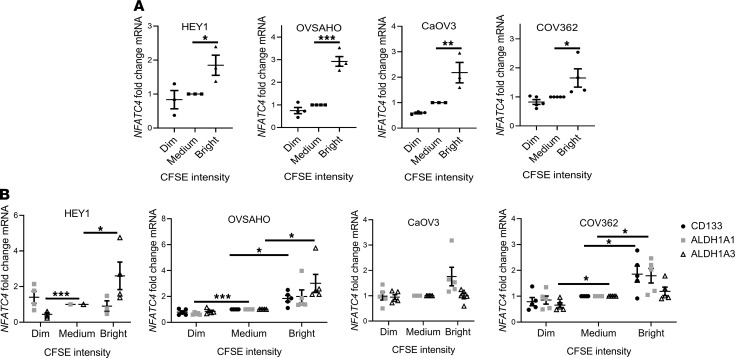
Figure 2. NFATC4 expression correlates with a decrease in cellular proliferation and an increase in cancer stem cell markers.
(A) NFATC4 mRNA expression levels in 4 cell lines (HEY1 n = 3, OVSAHO n = 4, CaOV3 n = 3, COV362 n = 4) stained with CFSE. CFSE intensity: bright, slowly dividing; medium, bulk cells; dim, rapidly dividing. (B) mRNA expression of the dominant ALDH genes (ALDH1A1/3) and CD133 in CFSE-stained cell lines: HEY1 (n = 4), OVSAHO (n = 4), CaOV3 (n = 5), COV362 (n = 5). One-way ANOVAs were performed to determine significance. *P < 0.05; **P < 0.01; ***P < 0.001.

