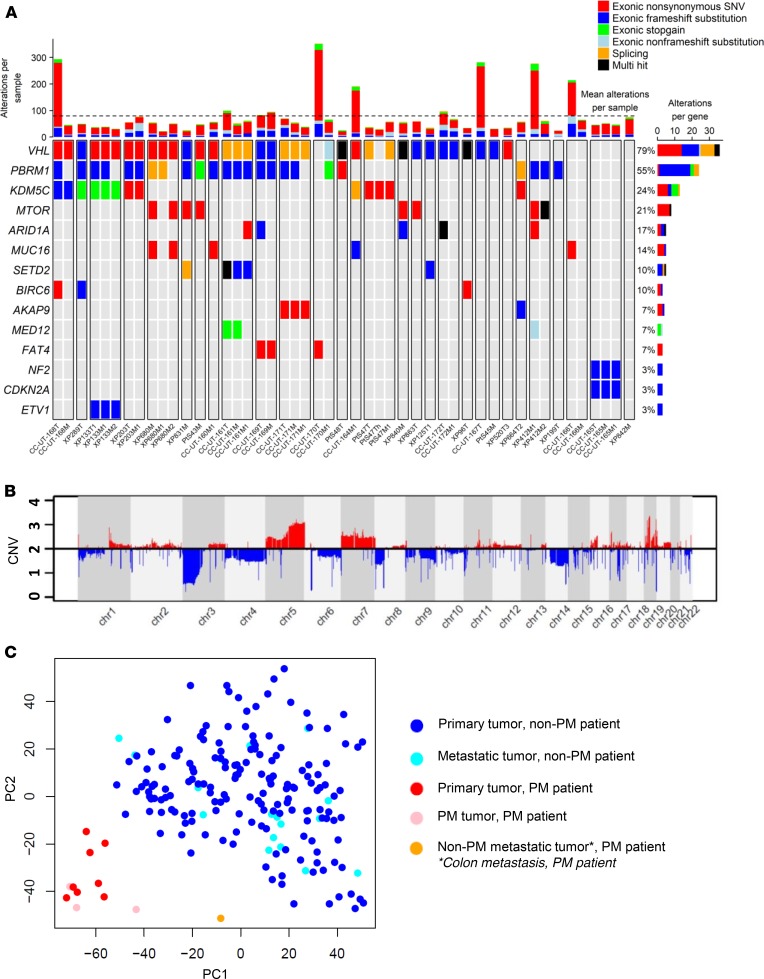
Figure 3. PM tumors are characterized by a mutational and copy number profile of less aggressive ccRCC, with clustered gene expression revealing constrained evolution.
(A) Oncoplot of somatic mutations based on the Catalogue of Somatic Mutations in Cancer in primary tumors (T suffix) and metastases (M suffix) from 31 patients with PM (separated by white lines). Most highly mutated genes are shown, with corresponding patient mutation percentages (left). (B) Average copy number alterations of primary and metastatic samples (n = 48) corresponding to 31 patients. (C) Principal component analysis of gene expression from fresh frozen PM primary tumors and metastases (n = 12) compared with controls (UT Southwestern) (Hotelling’s T-squared P < 1 × 10–16). PM, pancreatic metastases; ccRCC, clear cell renal cell carcinoma.

