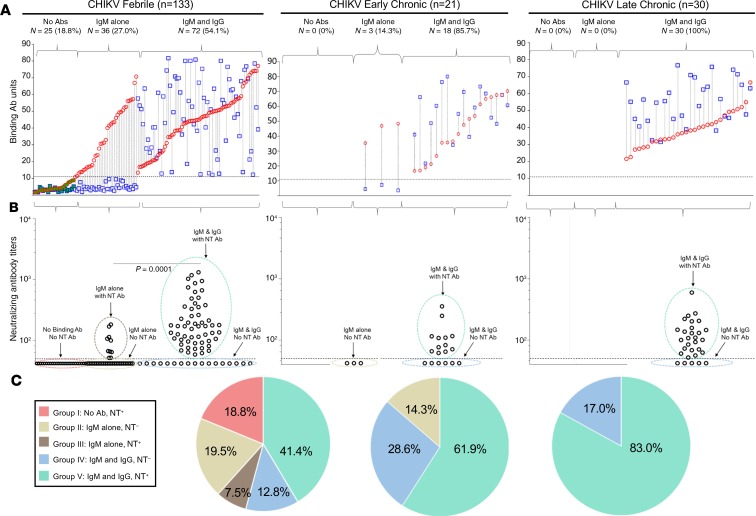
Figure 1. Diversity of the antibody response patterns in chikungunya acute febrile versus chronic patients.
(A) Paired analysis of CHIKV-specific plasma IgM (red circles) and IgG (blue squares) values in individual CHIKV-confirmed patients within the no antibodies, IgM-alone, or IgM and IgG antibody response patterns in the acute febrile (left, n = 133), early chronic (middle, n = 21), and late chronic (right, n = 30) phases. Within each antibody response pattern group, the patients are stratified based on increasing IgM values on the x axis. Horizontal dotted line indicates assay cutoff for IgM and IgG. The samples that were also positive for CHIKV PCR are indicated by green-filled symbols. (B) Evaluation of plasma CHIKV NT antibody activity in each of the patient groups that are described in A. Dotted gates were placed to further subgroup the patients based on a combination of IgM, IgG, and NT activity. NT assay limit of detection is indicated by the horizontal dotted line. The NT antibody titers were significantly different between the IgM-alone group and IgM and IgG group in the acute febrile patients. Statistical significance was calculated by unpaired Mann-Whitney U test. (C) Relative proportion of the patients with each of the indicated antibody response patterns shown in B among the CHIKV-confirmed patients in febrile phase (left), early chronic phase (middle), and late chronic phase (right).

