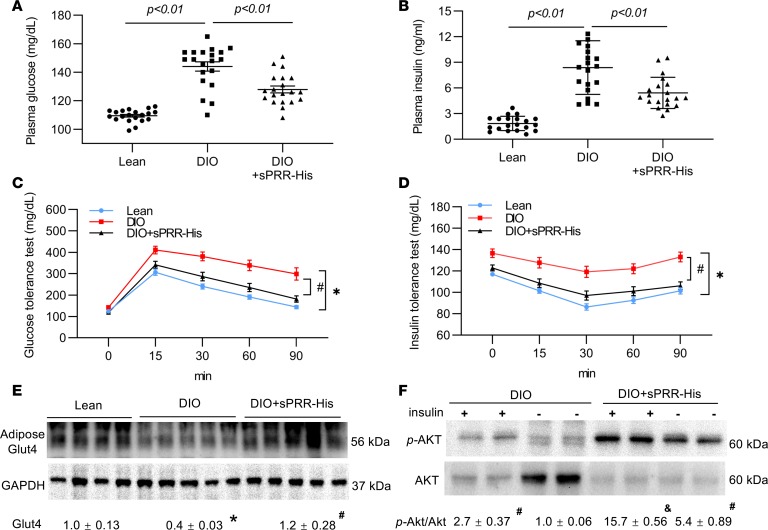
Figure 2. Effect of sPRR-His on glucose metabolism in DIO mice.
After 8 hours of fasting, a single dose of glucose (1 g/kg body weight) or insulin (0.75 U/kg body weight) was administered via i.p. injection. This was followed by a series of blood collections and measurement of blood glucose. (A) Plasma glucose (n = 20). (B) Plasma insulin (n = 20). (C) Glucose tolerance test (n = 20). (D) Insulin tolerance test (n = 20). (E) Immunoblotting analysis of adipose Glut4 expression (n = 9). The same samples were run on a separate gel for detecting GAPDH. (F) Immunoblotting analysis of p-AKT and AKT (n = 5). The blot was stripped and reprobed with anti-AKT antibody. Densitometry values are shown underneath the blots. *P < 0.05 vs. lean group, #P < 0.05 vs. DIO group, &P < 0.05 vs. DIO/insulin group. For C and D, xy analyses with area under curve and unpaired Student’s t test were performed. For the others, statistical significance was determined by using ANOVA with the Bonferroni test for multiple comparisons. Data are shown as mean ± SEM.

