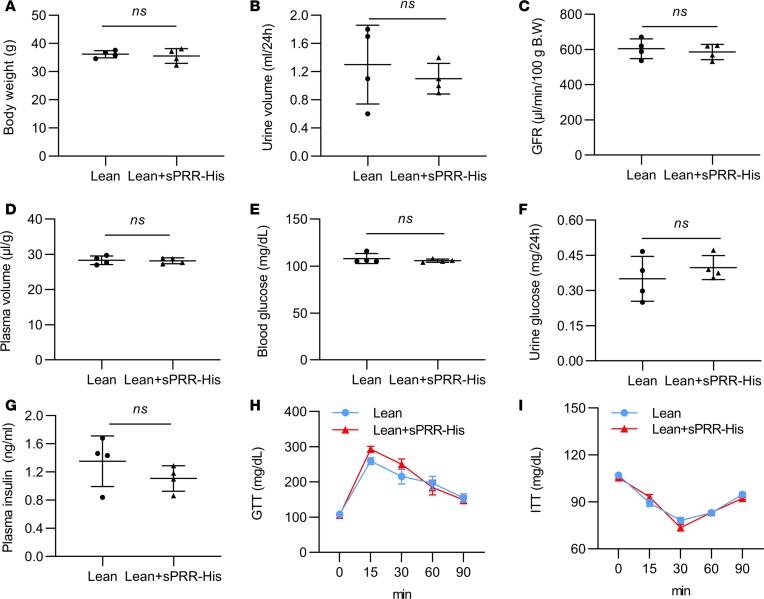
Figure 3. Effect of sPRR-His on body weight, renal function, and glucose metabolism in lean mice.
Lean mice were randomly divided to receive vehicle or sPRR-His for 2 weeks. (A) Body weight. (B) Urine volume. (C) GFR. (D) Plasma volume. (E) Blood glucose. (F) Urine glucose. (G) Plasma insulin. (H) GTT. (I) ITT. n = 4 per each group. For A–G, statistical significance was determined by using unpaired Student’s t test; for H and I, statistical significance was determined by using xy analyses with area under curve and unpaired Student’s t test performed. Data are shown as mean ± SEM.

