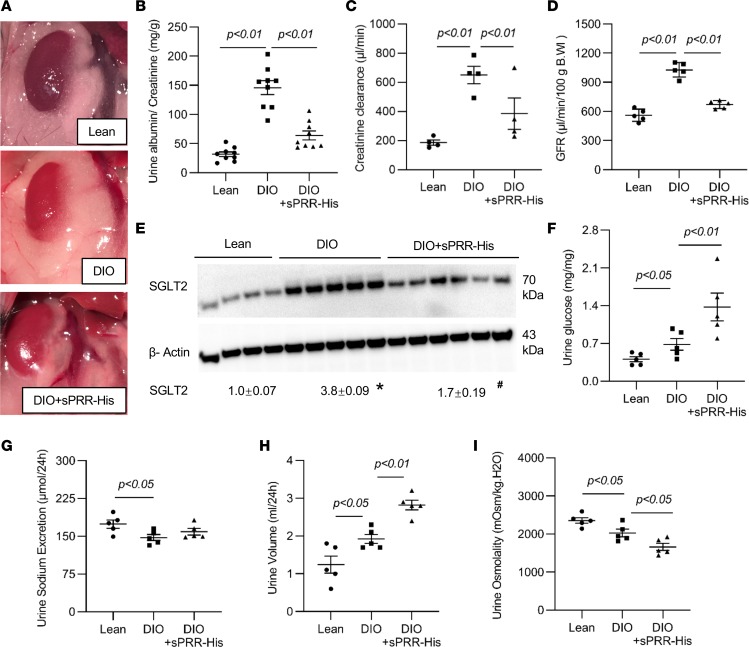
Figure 6. Effect of sPRR-His on renal function in DIO mice.
(A) Appearance of perirenal adipose tissue. (B) Urine albumin excretion (n = 9). (C) Creatinine clearance (n = 4). (D) GFR (n = 5). (E) Renal cortical SGLT2 expression (n = 8–9). The blot was stripped and reprobed with anti–β-actin antibody. (F) Urine glucose. (G) Urine sodium excretion (n = 5). (H) Urine volume (n = 5). (I) Urine osmolality (n = 5). *P < 0.05 vs. lean group, #P < 0.05 vs. DIO group. Statistical significance was determined by using ANOVA with the Bonferroni test for multiple comparisons. Data are shown as mean ± SEM.

