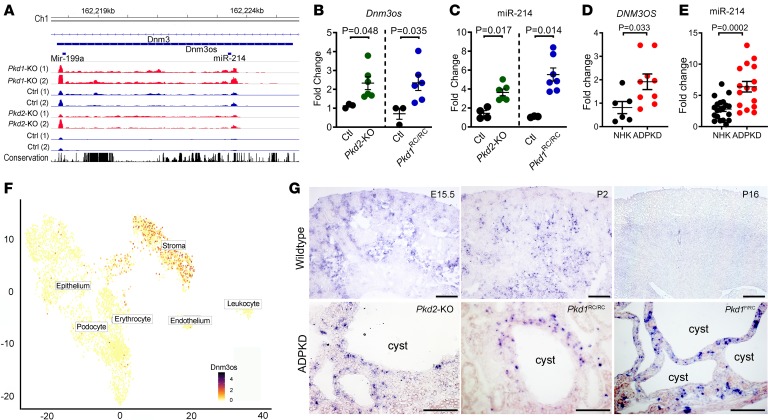
Figure 1. miR-214 and its host lncRNA DNM3OS are upregulated in ADPKD.
(A) lncRNA-Seq tracks showing upregulation of miR-214 and Dnm3os in 10-day-old Pkd1-KO (red tracks) and 21-day-old Pkd2-KO kidneys (red tracks) compared with their respective age-matched control kidneys (blue tracks). (B and C) Q-PCR analysis showing Dnm3os and miR-214 upregulation in kidneys from 21-day-old Pkd2-KO mice (green circles, n = 6) and 6-month-old Pkd1RC/RC mice (blue circles, n = 6) compared with kidneys from their respective age-matched control mice (black circles n = 3–4). (D and E) DNM3OS and miR-214 expression was also increased in cystic kidney tissue from individuals with ADPKD compared with normal human kidney (NHK) tissue. ADPKD: n = 9 for DNM3OS and n = 16 for miR-214. NHK: n = 6 for DNM3OS and n = 20 for miR-214. (F) T-distributed stochastic neighbor embedding plot of single-cell RNA-Seq from E18.5 kidney shows that stromal cells are the primary cellular source of Dnm3os. (G) In situ hybridization showing Dnm3os expression in stromal cells of E15.5 and 2-day-old postnatal kidney (P2). Dnm3os signal was reduced in kidneys from 16-day-old mice (P16). Dnm3os expression in kidneys of P16 Pkhd1/Cre Pkd2fl/fl (Pkd2-KO), 6-month-old Pkd1RC/RC, and P18 Pkd1fl/RC mice is shown at the bottom. Dnm3os expression was predominantly observed in cells surrounding cyst epithelia. Scale bars: 100 μm; Student’s unpaired t test (B, C, D, and E); error bars indicate standard error of the mean (SEM).

