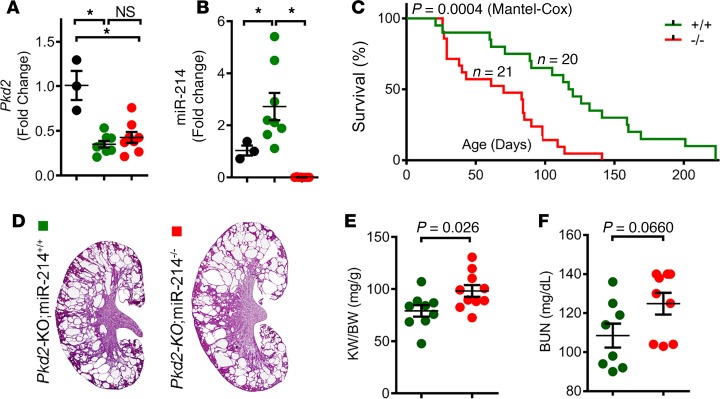
Figure 2. miR-214 deletion aggravates cyst growth in Pkd2-KO mice.
To determine the role of miR-214 in ADPKD, we generated Pkd2-KO miR-214+/+ (Pkd2-KO) mice and Pkd2-KO miR-214–/– mice. (A) Q-PCR analysis showing that Pkd2 expression was reduced equally in Pkd2-KO (green circles, n = 8) and Pkd2-KO miR-214–/– (red circles, n = 8) kidneys compared with noncystic control kidneys (black circles, n = 3), indicating equivalent recombination. (B) Q-PCR analysis showed miR-214 upregulation in Pkd2-KO kidneys (green circles, n = 8) compared with control kidneys (black circles, n = 3). As expected, miR-214 expression was abolished in Pkd2-KO miR-214–/– mice (red circles, n = 8). (C) Kaplan-Meier survival curves of Pkd2-KO miR-214–/– mice (red line, n = 21) and Pkd2-KO mice (green line, n = 20). The median survival was reduced in Pkd2-KO miR-214–/– mice compared with Pkd2-KO mice. (D) H&E-stained kidney sections of 35-day-old Pkd2-KO and Pkd2-KO miR-214–/– mice are shown. (E) Kidney weight/body weight (KW/BW) ratio and (F) BUN levels of 35-day-old Pkd2-KO miR-214–/– mice (n = 9–10) and Pkd2-KO (n = 8–9) mice are shown. *P < 0.05; 1-way ANOVA, Tukey’s multiple-comparisons test (A and B); Mantel-Cox test (C); Student’s unpaired t test (E and F); error bars indicate SEM.

