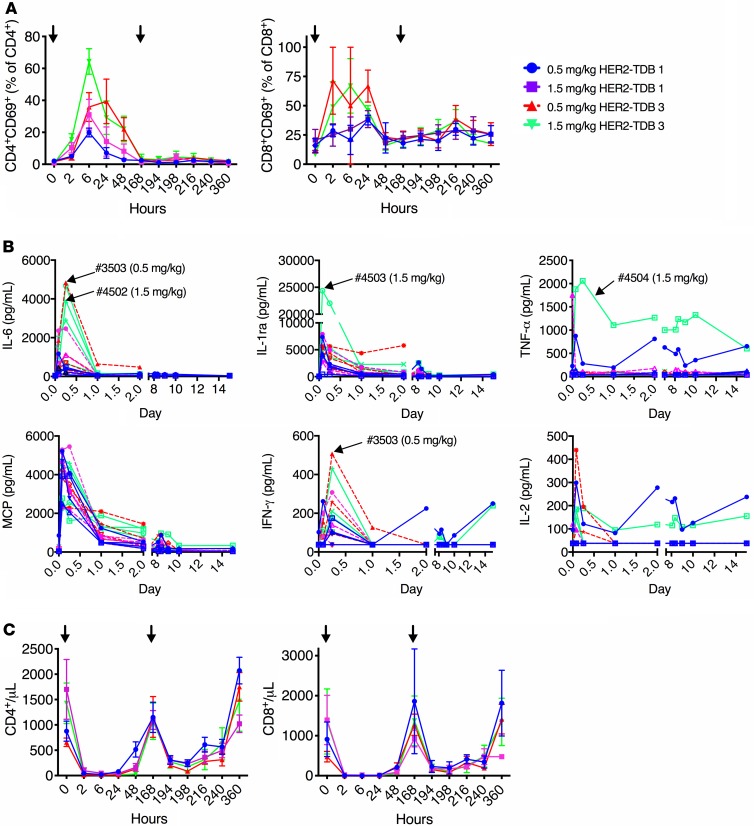
Figure 5. Impact of HER2 affinity to anti-HER2/CD3 TDB induced leukocyte changes and acute systemic cytokine release in cynomolgus monkeys.
Cynomolgus monkeys were treated with 0.5 and 1.5 mg/kg of HER2–TDB 1 (lower HER2 affinity; blue and magenta, respectively) or HER2–TDB 3 (higher HER2 affinity; red and green, respectively) on days 0 and 7. (A–C) Peripheral blood was sampled at indicated time points and analyzed for T cell activation (CD69) (A), systemic cytokine levels (B), and number of CD8+ and CD4+ lymphocytes (C). Data are presented as mean ± SEM (A and C) or individual animals (B). Arrowheads indicate time of dosing (A and C) or point out individual animals where dosing was not tolerated (3503 and 4502) or tolerated (4503 and 4504) (B). n = 3–4 for each treatment group.

