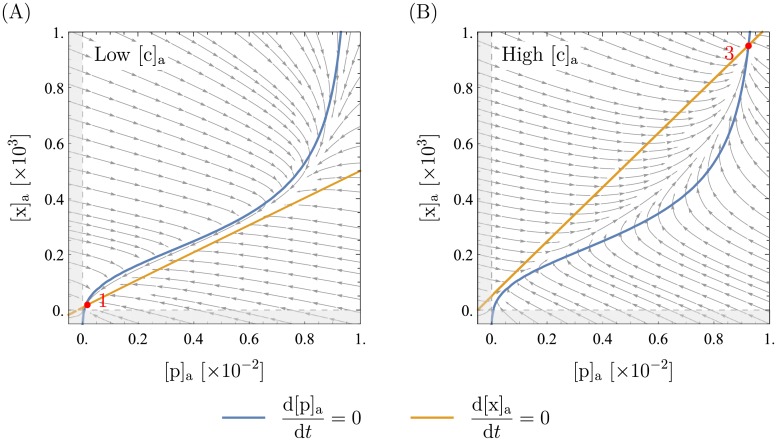
Fig 6. Phase portraits for different extracellular xanthosine concentrations.
All parameters but [c]a are as presented in Table 1. The extracellular xanthosine concentration in these plots is [c]a = 7 in (A) and [c]a = 40 in (B) (recall that with Ka = 5 ⋅ 10−5M, so [c]a is dimensionless). Tuning [c]a moves the orange line (xanthosine nullcline), but the blue curve (mRNA nullcline) is unchanged (see also S1 Text). It can clearly be seen that in (A) there is only the lower fixed point (fixed point number 1), whereas in (B) there is only the upper one (fixed point number 3). In between lies the bistable case that was shown in Fig 5.

