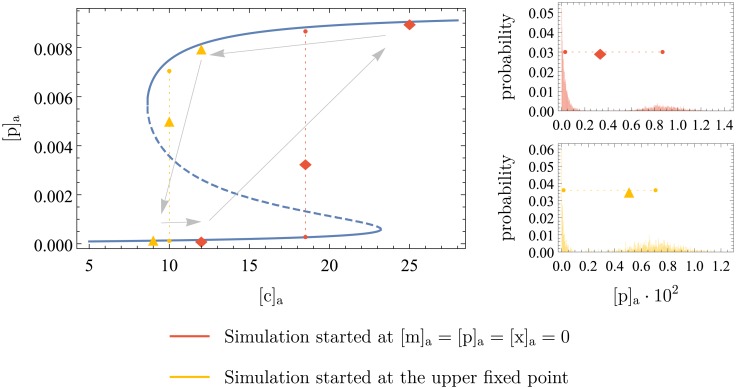
Fig 11. Bifurcation diagram showing the hysteresis loop in the stochastic system.
The blue line shows the positions of the deterministic fixed points, while the dashed line indicates the instability of the middle one. The orange and yellow points show the mean of the stochastic simulations when started at zero and at the high fixed point, respectively. The positions of the two peaks in the bimodal distributions are indicated by smaller points, connected by dotted lines. To make this clearer, the bimodal distributions themselves are shown on the right. The arrows illustrate the hysteresis loop in the stochastic simulations.

