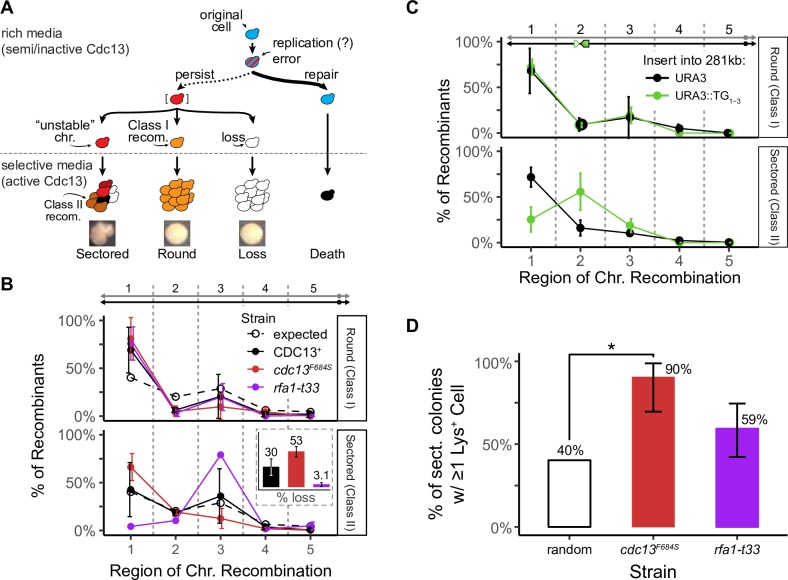
Fig 6. Class I and Class II recombinants at a semi-restrictive temperature (30°C).
(A) Schematic of how diversity arises from one unstable chromosome. (B) Distribution of genotypes from round (Class I recombinants) and sectored colonies (Class II recombinants) from cdc13F684S (black) or rfa1-t33 (purple). The expected distribution (“random”) is dashed. The average percentage and standard deviation for 3 independent experiments are shown. Inset: the frequency of chromosome loss within the sectored colony for cdc13F684S (black) and rfa1-t33 (purple). (C) Distribution of Class II recombinants from sectored colonies from cdc13F684S with URA3 or URA3::TG1-3 inserted into the 281 kb locus. The average percentage and standard deviation for 3 independent experiments are shown. (D) Average percentage with 95% confidence interval of sectored colonies that retained at least 1 Lys+ cell for cdc13F684S and rfa1-t33. The expected distribution (“random”) is white (* < 0.01, one sample t test).

