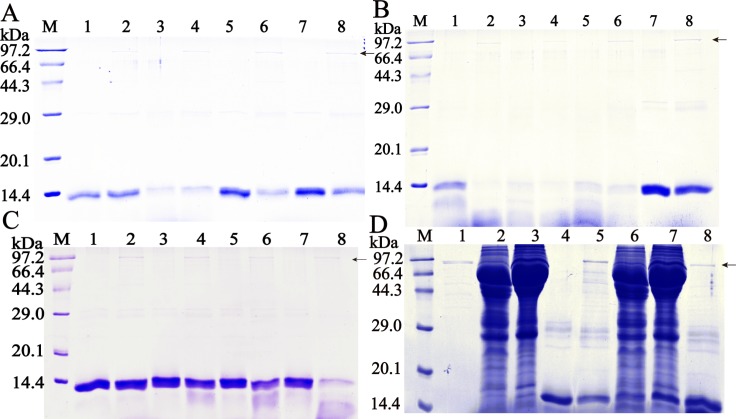
Fig 4. Hemoglobin degradation.
A-B Hydrolysis of Hb by rTsASP2 at different pH values. A: human Hb; B: mouse Hb; M: protein marker; lanes 1, 3, 5 and 7: Hb alone; lanes 2, 4, 6 and 8: Hb+ rTsASP2; lanes 1 and 2: pH 2.5; lanes 3 and 4: pH 3.5; lanes 5 and 6: pH 4.5; lanes 7 and 8: pH 5.5. C: Hydrolysis efficiency effect of rTsASP2 on mouse Hb (pH 2.5). M: protein marker; lanes 1, 3, 5 and 7: Hb alone; lanes 2, 4, 6 and 8: Hb+ rTsASP2; lanes 1 and 2: 5 min; lanes 3 and 4: 30 min; lanes 5 and 6: 90 min; lanes 7 and 8: 4 h. D: Inhibition effect of anti-rTsASP2 serum and pepstatin A on rTsASP2 hydrolysis of mouse Hb (pH 2.5). M: protein marker; lane 1: rTsASP2; lane 2: anti-rTsASP2 serum; lane 3: heated anti-rTsASP2 serum; lane 4: Hb; lane 5: Hb +rTsASP2; lane 6: anti-rTsASP2 serum pre-incubated with rTsASP2 +Hb; lane 7: heated anti-rTsASP2 serum pre-incubated with rTsASP2+ Hb; lane 8: pepstatin A pre-incubated with rTsASP2 + Hb. The arrow represents the band of rTsASP2 (86.4 kDa).

