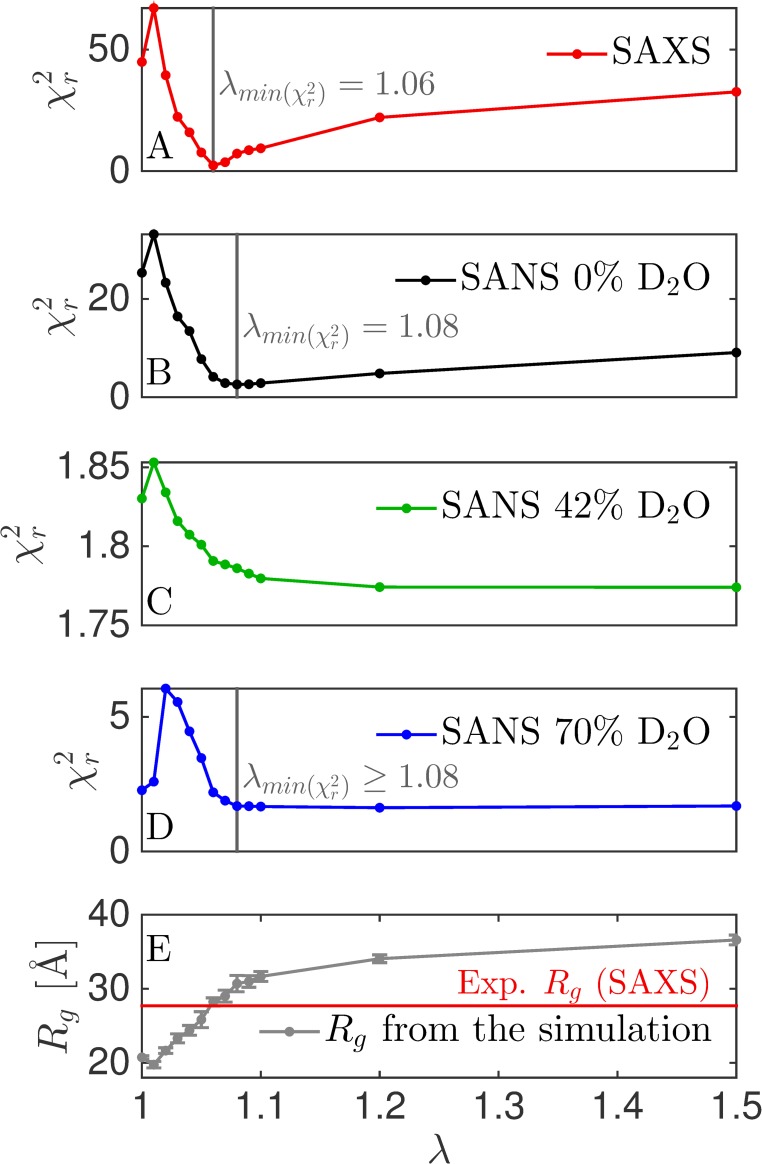
Fig 3. Tuning the protein-water interaction strength of the Martini force field.
We varied the protein-water interaction strength by a factor λ, and calculated for each dataset (A-D). Vertical grey lines are the values of λ giving the best fit to the given dataset. No vertical line is given for SANS at 42% D2O as the variation is is very small. (E) Average Rg as calculated directly from the simulation. The horizontal red line is the value of Rg determined from the SAXS data.

