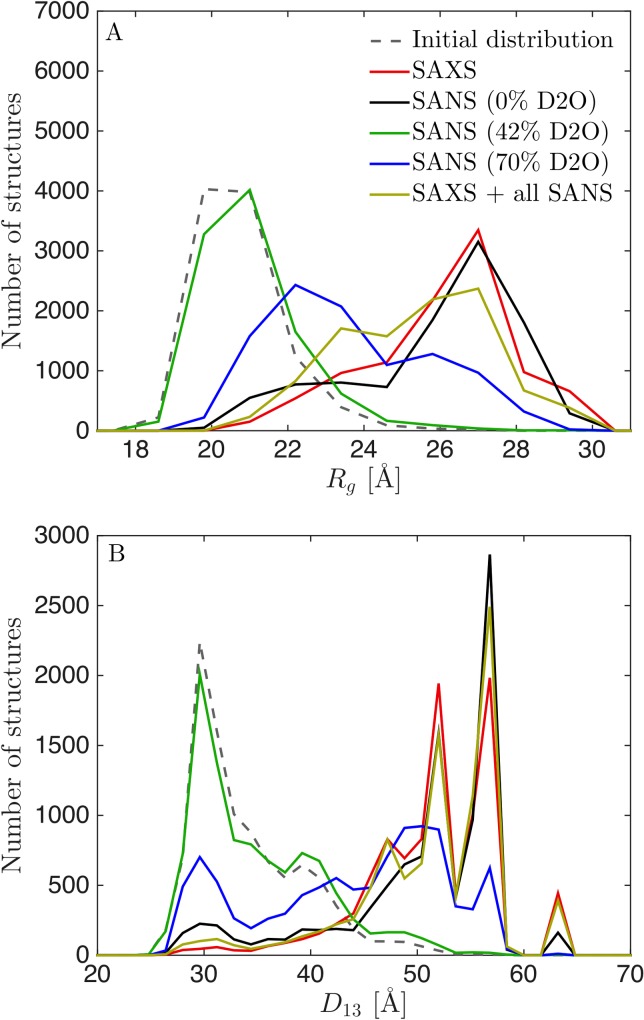
Fig 7. Distributions of Rg (A) and D13(B) after reweighting from unaltered simulation (λ = 1.00) using SAXS and SANS data.
(A) Distribution of Rg and (B) distribution of D13 after reweighting with SAXS alone (red), with SANS at 70% D2O (black), SANS at 42% D2O (green), SANS at 70% D2O (blue) and with all SAXS and SANS data (yellow).

