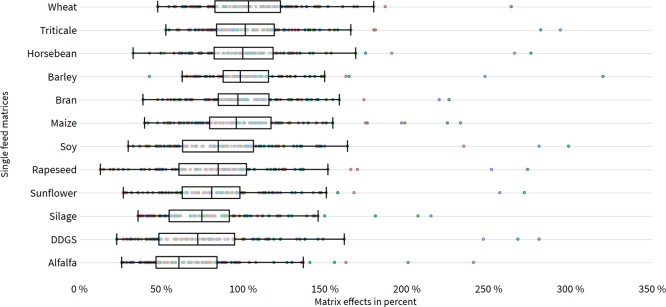
Figure 3.
Scatter plot illustrating matrix effects in percent (x-axis) expressed as SSE for 12 single feed matrices (y-axis). Each target analyte is depicted by a colored dot. The outlier-corrected box plot includes an interquartile range of 1.5, representing John Tukey’s standard value.25

