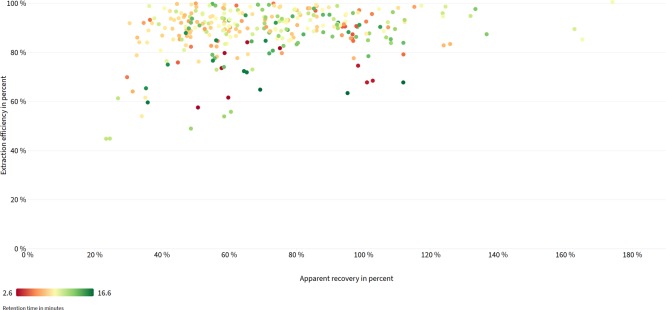
Figure 8.
Basic scatter plot visualizing apparent recoveries (x-axis) and extraction efficiencies (y-axis) for selected analytes in complex model matrices. Each target analyte is represented by a colored dot. Retention times are reflected by different colors from purple (polar compounds) to green (apolar compounds).

