Figure 4.
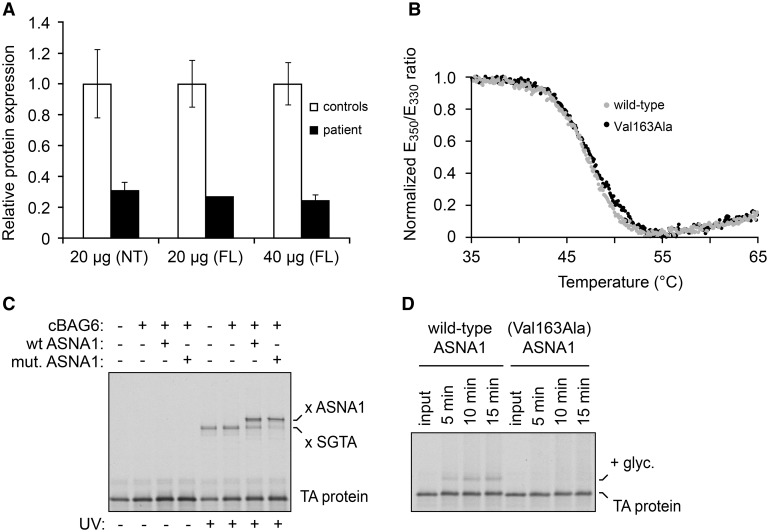
Biochemical analyses of ASNA1. A, Expression levels of ASNA1 protein in skin fibroblasts from patient II:2 compared with healthy controls, and normalized against GAPDH as measured by Western blot analysis. Relative expression is expressed as mean±SD from 1 to 3 different experiments. Error bars represent SD. B, Thermal unfolding curves of purified recombinant wild-type and Val163Ala mutant ASNA1. The ratio of tryptophan fluorescence emission at 350 nm to 330 nm was measured during a temperature ramp. The ratio was normalized using the highest and lowest values and scaled to 1.0 and 0, respectively. This ratio is sensitive to the environment around the tryptophan, and therefore changes during protein unfolding. Both wild-type and mutant ASNA1 unfold at the same temperature (between 45°C and 50°C), indicating that they are comparably stable. C, Radiolabeled TA (tail-anchored) protein assembled on the chaperone Small Glutamine Rich Tetratricopeptide Repeat Containing Alpha (SGTA) was mixed with wild-type or mutant ASNA1 together with the cBAG6 (complement BCL2 Associated Athanogene 6) complex (which bridges SGTA and ASNA1), incubated for 90 seconds, and subjected to UV-induced crosslinking. In the reaction lacking ASNA1, the TA protein crosslinks to SGTA (x SGTA) in a UV-dependent manner. Transfer from SGTA to ASNA1 (as evidenced by crosslinking to ASNA1 after incubation) is observed for wild-type and Val163Ala mutant ASNA1. D, Radiolabeled TA protein in complex with either wild-type or Val163Ala mutant ASNA1 (Figure VD in the Data Supplement) was incubated with ER microsomes for the indicated times. Input indicates an aliquot of the starting complex analyzed for comparison. ER insertion was monitored by the appearance of a glycosylated form of the TA protein (indicated by + glyc). Insertion is less efficient for the reactions containing mutant ASNA1. FL indicates full-length; and NT, N-terminus.

