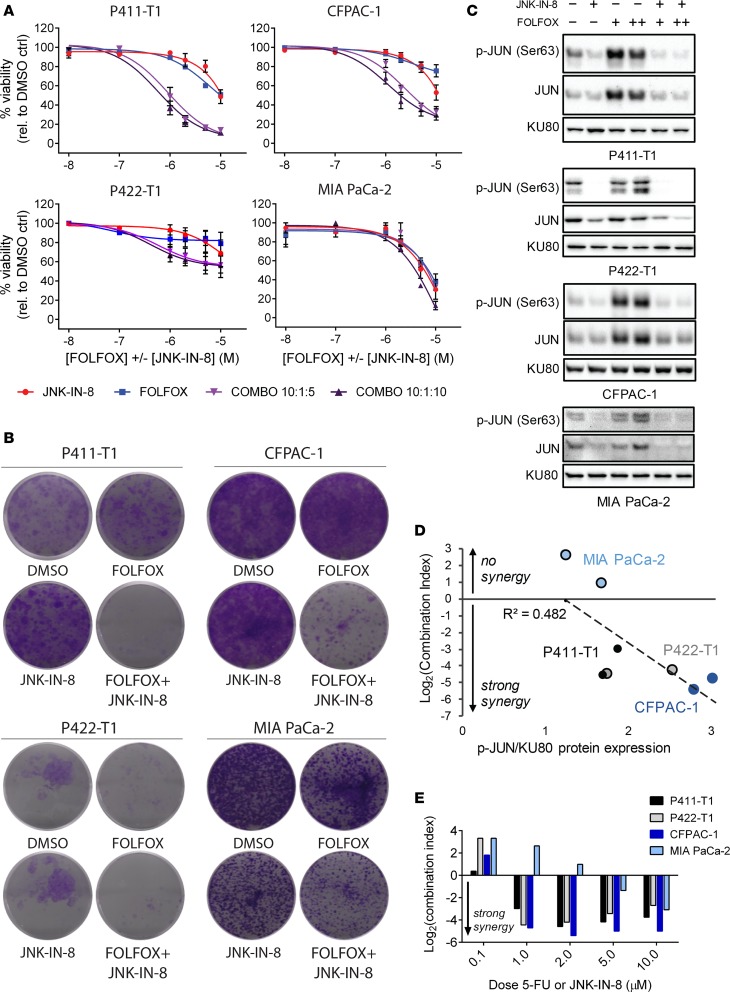
Figure 3. JNK-IN-8 enhances FOLFOX growth inhibition and reverses FOLFOX-induced JUN activation in vitro.
(A) Dose-response curves for JNK-IN-8 (red), FOLFOX (blue), and 2 constant ratio combinations of the pair (purples). Results shown are mean ± SEM normalized percent viability (n = 3). (B) Crystal violet–stained cell colonies after 14 days of twice-weekly dosing of the indicated drug regimen (5-FU/OX/JNK-IN-8 [nM]: P411-T1, 400:40:1000; P422-T1, 200:20:200; CFPAC-1, 200:20:200; MIA PaCa-2, 1000:100:1000). (C) Representative immunoblots for P411-T1, P422-T1, CFPAC-1, and MIA PaCa-2 cells treated for 72 hours with the designated regimen (JNK-IN-8 = 1 μM; +FOLFOX = IC10 dose by MTT; ++FOLFOX = IC25 dose by MTT). KU80 was used as loading control for 422-T1, run on parallel gel. (D) Synergy represented by log2(CI) plotted against p-JUN/KU80 immunoblot expression at 1- and 2-μM doses. Trendline with correlation coefficient R2 shown. (E) Synergy as log2(CI) across doses from 72-hour MTT assay shown in A, where negative log2(CI) values indicate synergy.

