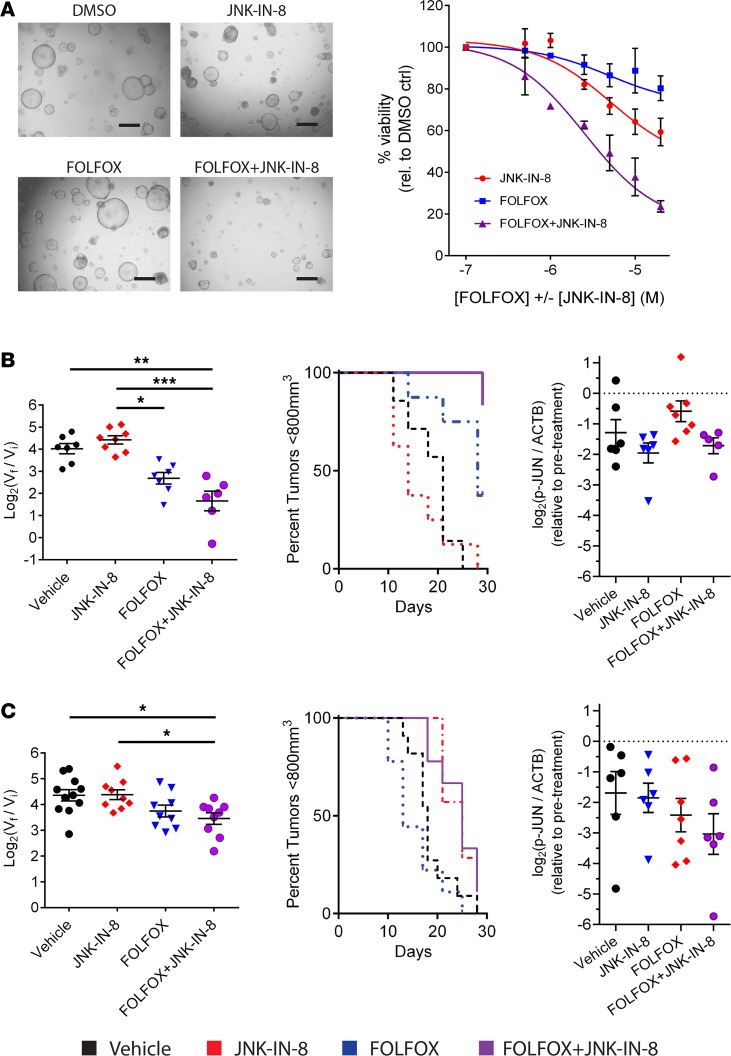
Figure 4. JNK-IN-8 enhances growth inhibition by FOLFOX in PDX organoids and tumors corresponding to sustained p-JUN inhibition.
(A) Organoid viability by bright-field microscopy at 1-μM doses of indicated treatments (left) and quantified across a broad range of doses by CellTiter-Glo 3D with normalization to DMSO vehicle (right) in 319-T1 organoids (n = 2). Scale bars: 500 μm. (B) In vivo 319-T1 PDX tumor growth displayed as box plots of log2(tumor volume fold change at 28d endpoint versus treatment initiation) and Kaplan-Meier survival plots with a tumor volume cutoff of 800 mm3. Log transformed ratio of p-JUN/ACTB protein levels by immunoblot from the same 319-T1 PDX tumors harvested before and after 28d treatments of respective drug regimens. Data normalized to pretreatment biopsy tumors. ACTB used as loading control. (C) In vivo 411-T1 PDX tumor growth data and p-JUN inhibition by immunoblot as above. Each group contained at least 5 mice. Significance determined by 1-way ANOVA with Tukey multiple comparisons tests. *P < 0.05; **P < 0.01, ***P < 0.001.

