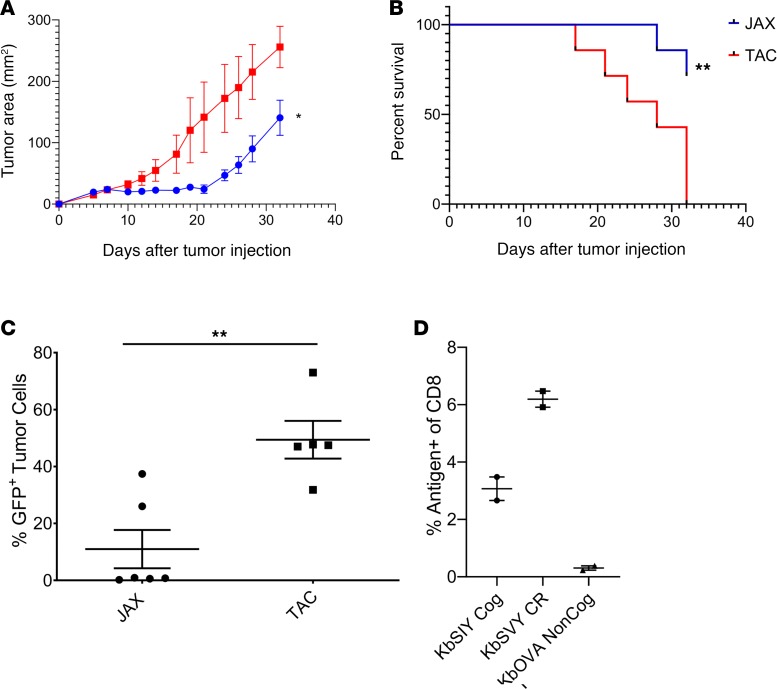
Figure 5. Jackson mice have an increased antitumor response and antigen-selective pressure on the tumor.
(A) Jackson and Taconic mice were injected with 2 × 10⁶ B16.SIY cells subcutaneously on day 0. Tumor growth curves show Jackson mice have significantly delayed tumor growth as compared with Taconic mice. P value = 0.0455. Significance was measured by 2-way ANOVA with Bonferroni’s post hoc test for multiple comparisons. N = 7/group. (B) Additionally, Jackson mice had significantly increased survival compared with the Taconic mice. P = 0.0065. Significance was measured by the log-rank test (Mantel-Cox test). N = 7/group. (C) Jackson and Taconic mice were injected with 2 × 10⁶ B16.SIY cells subcutaneously on day 0. Tumors were harvested at an approximate size of 200–250 mm2 and analyzed by flow cytometry for GFP expression, as SIY and GFP are expressed as a fusion protein in the B16.SIY cell line (15). Jackson have a significantly lower GFP expression (P value = 0.0030) by unpaired, 2-tailed t test (n = 5 TAC, and n = 6 JAX). (D) Jackson and Taconic mice were injected with 2 × 10⁶ B16.SIY cells subcutaneously on day 0. Tumor-infiltrating lymphocytes were harvested on day 24 and analyzed by flow cytometry for CD8+ T cell specificity, gated on live CD8+ T cells. N = 2/group.

