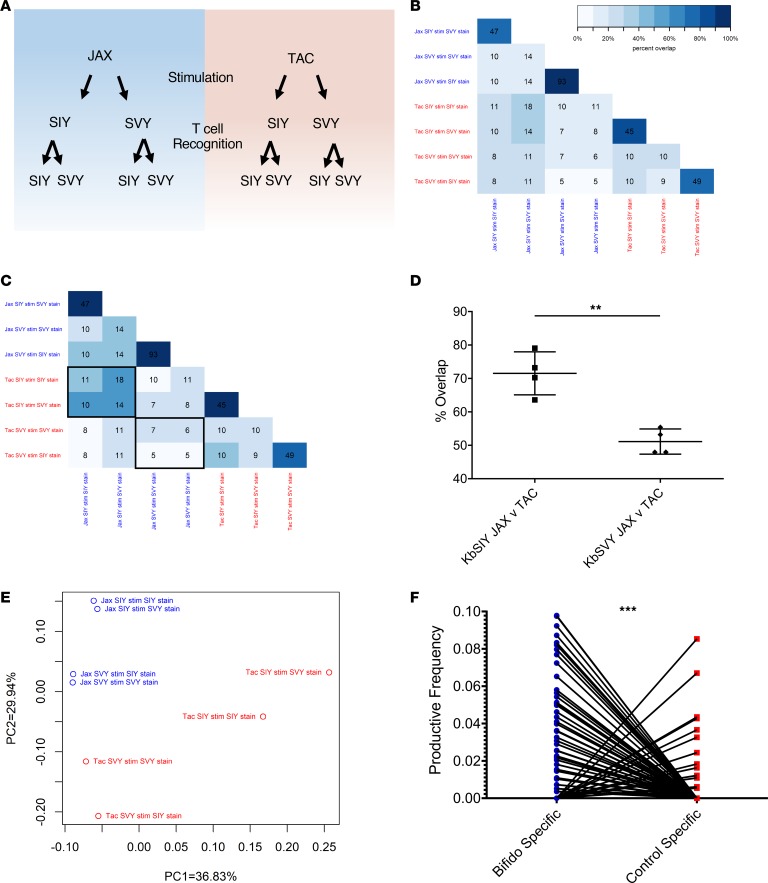
Figure 6. B. breve colonization shapes the KbSVY TCR repertoire.
(A) Schematic setup of TCR repertoire analysis. CD8+ T cells from Jackson and Taconic mice were stimulated with KbSIY or KbSIY aAPCs. On day 7, cells from each stimulation were stained and sorted by antigen reactivity (KbSIY or KbSVY) and processed for TCR β chain deep sequencing. (B) Exact TCR clone overlap between all repertoires. Numbers indicate the number of unique overlapping clones between 2 TCR repertoires, and the color scale indicates the percentage contribution of the overlapping sequences to the total combined repertoire for each pair. (C) TCR clone overlap between all repertoires based on TCR homology using ImmunoMap algorithm. Numbers indicate the number of homologous clusters shared between 2 TCR repertoires, and the color scale indicates the percentage contribution of shared clusters to the total combined repertoire for each pair. (D) Overlap between Jackson and Taconic mice of T cell repertoires stimulated by SIY or SVY based on the frequency of homologous TCR clones and overlap between SIY and SVY stimulations for Jackson or Taconic mice groups. Data included the cognate and cross-reactive sorted populations, as indicated by the black boxes in C. P value = 0.0016 by 2-tailed t test. N = 4. Data represent mean ± SEM. (E) PCA of homology-based TCR clusters. TCR repertoires were analyzed by CDR3 sequence homology and separated into dominant motifs. (F) TCR β chain deep sequencing was performed on Jackson mouse splenocytes incubated with or without heat-killed Bifidobacterium. TCR clones with a Hamming distance of 1 were defined as homologous to clones from aAPC-expanded KbSIY- or KbSVY-specific T cells. Productive frequency of these homologous clones from Bifidobacterium-stimulated and unstimulated cells is shown. P value = 0.0001 by 2-tailed t test.

