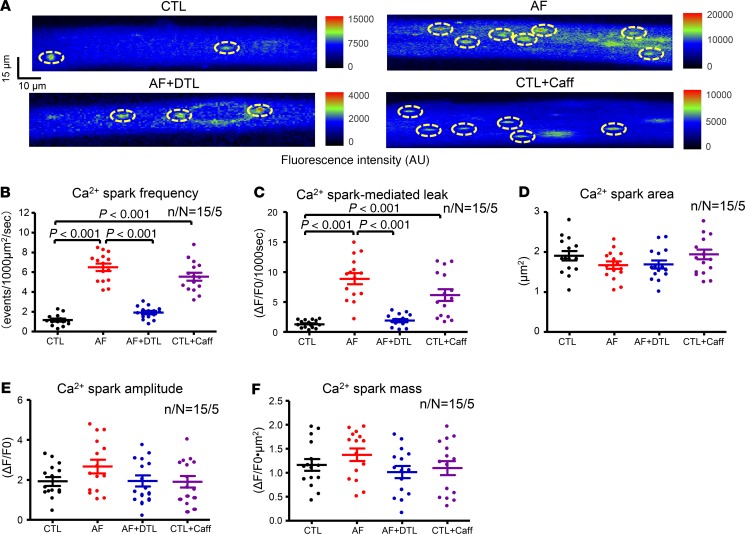
Figure 3. Cardiomyocyte spontaneous Ca2+ sparks on 2-dimensional confocal imaging.
(A) Fluorescence imaging of [Ca2+]i showing spontaneous Ca2+ sparks in each group. The yellow dashed ovals indicate sparks our analysis software identified for each condition. (B–F) Quantification of spontaneous Ca2+ spark frequency (B), Ca2+ spark–mediated leak (C), Ca2+ spark area (D), Ca2+ spark amplitude (E), and Ca2+ spark mass (F) under each condition. Each point represents the result from a single cell. Horizontal lines show mean ± SEM. n/N = 15 cells from 5 dogs per group for all measures. 1-way ANOVA followed by Bonferroni’s post hoc test. AF + DTL, dantrolene-treated AF cells; CTL + Caff, caffeine-treated CTL atrial cells.

