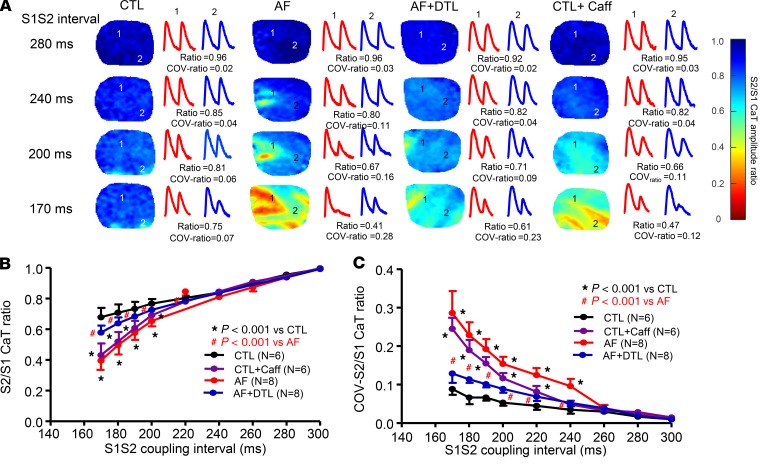
Figure 4. Spatial dispersion of CaT restitution properties upon optical mapping in situ.
(A) Maps of S2/S1 CaT amplitude ratio (color scale at right) during progressive decreases in S1-S2 coupling interval for each condition (left columns). Original recordings of the basic CaT (the first CaT) and the premature stimulation–induced CaT (the second CaT) from sites 1 and 2 for each condition are shown in the right columns. (B) Average S2/S1 CaT amplitude ratio for different S1-S2 coupling intervals in each group. (C) Average coefficient of variation (COV) of S2/S1 (COV S2/S1) CaT amplitude ratio for different S1-S2 coupling intervals in each group. Horizontal lines show mean ± SD. N = 6 for CTL and CTL + Caff; N = 8 for AF and AF + DTL. 2-way repeated-measures ANOVA followed by Bonferroni-corrected post hoc tests. CTL + Caff, CTL atria after caffeine treatment; AF + DTL, AF atria after dantrolene treatment.

