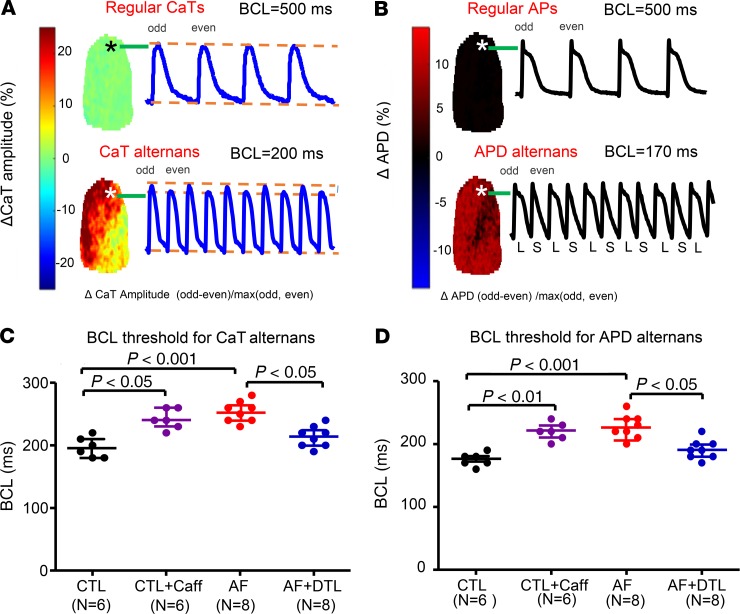
Figure 6. CaT and APD alternans thresholds in optically mapped preparations.
(A) Example of CaT alternans from a CTL atrium. Top: ΔCaT amplitude map (left) and a CaT recording from a single pixel (position shown with star on map) at 500-ms basic cycle length (BCL). Bottom: ΔCaT amplitude map (left) and a CaT recording from a single pixel at 200-ms BCL. (B) Example of APD alternans from the same CTL atrium. Top: ΔAPD map (left) and action potential recording from a single pixel at 500-ms BCL. Bottom: ΔAPD map (left) and action potential recording at 170-ms BCL. BCL threshold for CaT (C) and APD (D) alternans in each group; each point represents the result from a single atrium. Horizontal lines show median values and interquartile range for BCLs that induced CaT or APD alternans. N = 6 for CTL and CTL + Caff; N = 8 for AF and AF + DTL. Nonparametric Kruskal-Wallis test. CTL + Caff, CTL atria after caffeine treatment; AF + DTL, AF atria after dantrolene.

