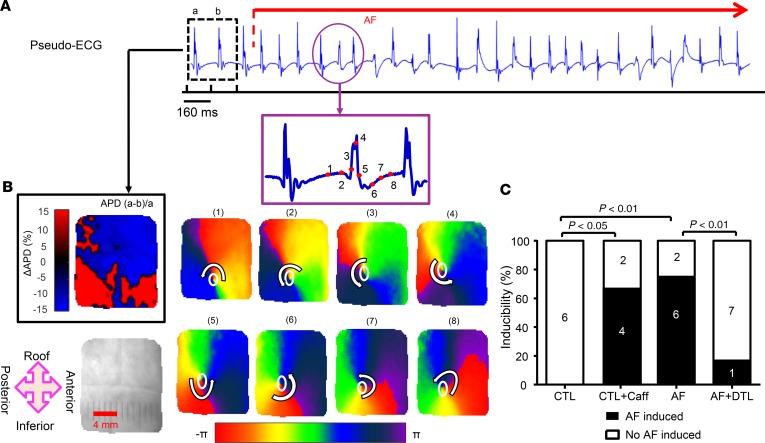
Figure 8. Initiation of AF in 1 optically mapped AF atrium.
(A) Right atrium pseudo ECG during AF initiated by pacing at 160-ms BCL. (B) Upper-left panel shows the ΔAPD map for complexes corresponding to cycles a and b on the pseudo ECG (the penultimate paced complexes prior to AF initiation). The subsequent panels show 8 snapshots of phase maps corresponding to the time points indicated in red points of the amplified pseudo ECG episode. The positions of phase singularities (PSs) are indicated by white ovals. (C) Inducibility of AF in each group. The vulnerability to AF was significantly increased in AF atria; DTL reduced AF vulnerability in AF atria, whereas Caff enhanced AF vulnerability in CTL atria. N = 6 for CTL and CTL + Caff; N = 8 for AF and AF + DTL. χ2 test. CTL + Caff, CTL atria after caffeine treatment; AF + DTL = AF atria after dantrolene treatment.

