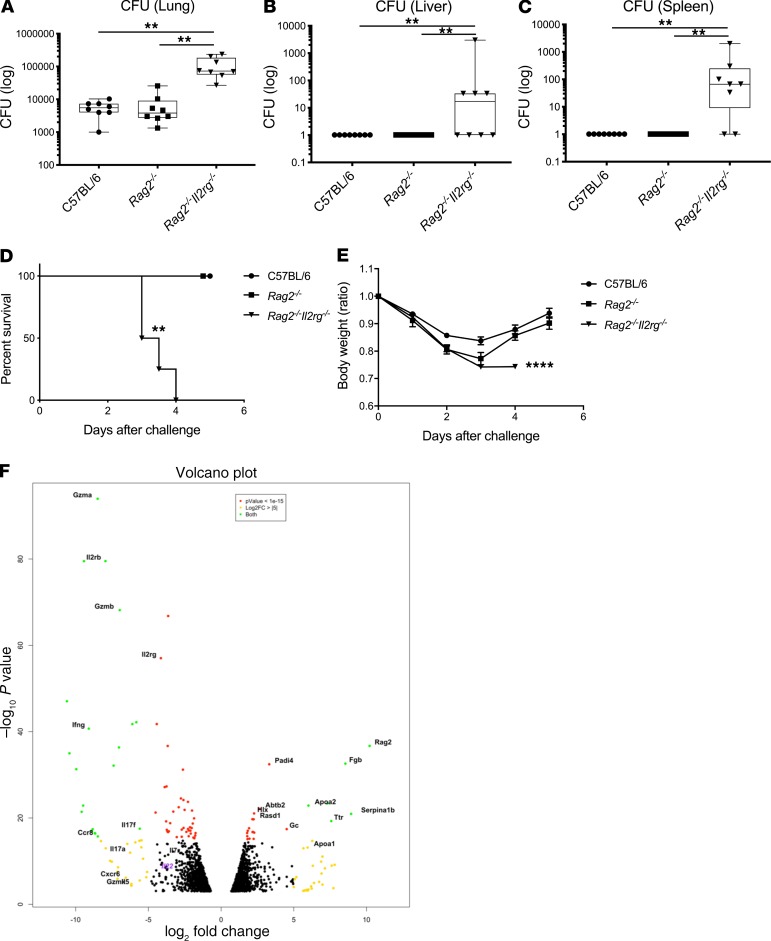
Figure 1. Rag2–/– Il2rg–/– mice are susceptible to the ST258 C4 pulmonary infection and lack type1 and type3 cytokine expression.
C57BL/6 mice, Rag2–/– mice and Rag2–/– Il2rg–/– mice were infected intratracheally with 1 × 10⁶ CFU ST258 C4 and euthanized at 24 hours. (A–C) Bacterial CFU in lungs (A), liver (B), and spleen (C) are representative as box and whisker plots showing median, first and third quartiles, and maximum and minimum values (n = 8, two independent experiments). Significant differences are designated by using Kruskal-Wallis test followed by Dunn’s multiple comparisons test. **P < 0.01 (D) Kaplan–Meier survival curves of mice infected with 1 × 10⁷ CFU ST258 C4. Significant differences were designated by log-rank test (n = 5, 2 independent experiments). **P < 0.01 versus C57BL/6 and Rag2–/– mice. (E) Weight change for comparing C57BL/6 mice, Rag2–/– mice, and Rag2–/– Il2rg–/– mice were also observed (n = 4–5, two independent experiments). Significant differences are designated by using 1-way ANOVA followed by Tukey’s multiple comparisons test. ****P < 0.0001 versus C57BL/6 and Rag2–/– mice. (F) Volcano plot of differentially expressed genes in lungs between infected Rag2–/– versus Rag2–/– Il2rg–/– mice 12 hours after infection (n = 3).

