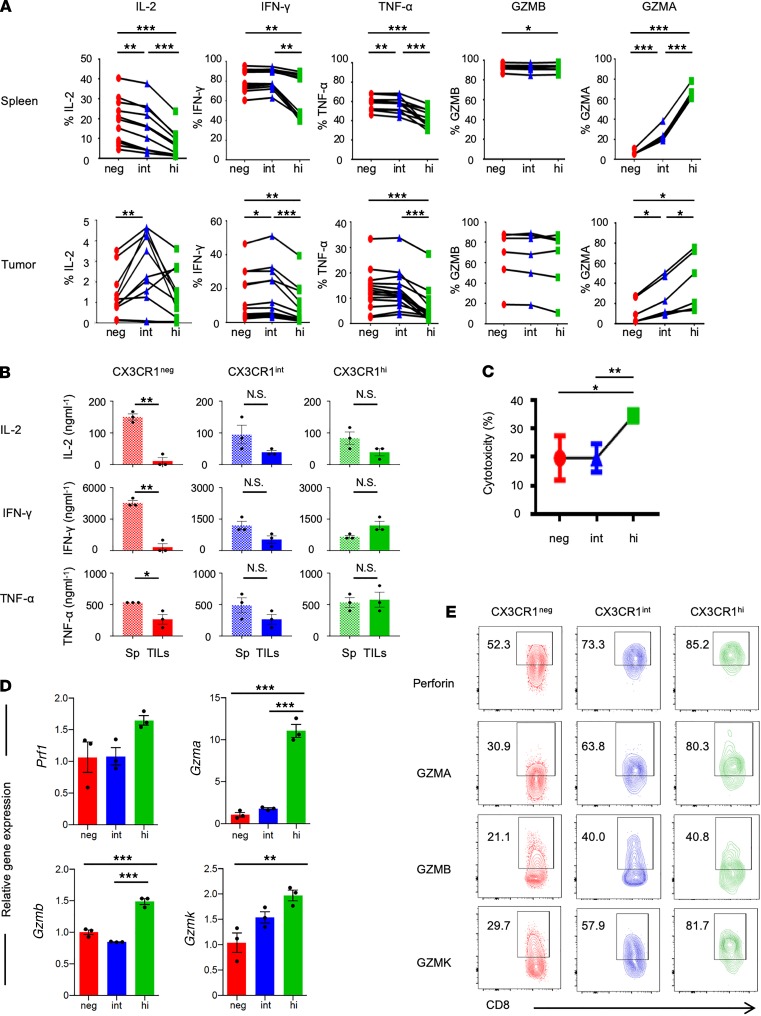
Figure 4. Functional heterogeneity of 3 subsets of tumor-infiltrating antigen-specific CD8+ T cells defined by CX3CR1.
(A) Intracellular production of cytokines against hgp100 peptide and granzymes by Pmel-1 T cells in spleen (upper) and the tumor (lower) 7 days after adoptive transfer. Ex vivo production of cytokines and granzymes shown in the panel are calculated based on the percentages of positive cells. n = 2 experiments pooled. *P < 0.05, **P < 0.01, and ***P < 0.005 by 1-way ANOVA test with Tukey’s multiple comparisons. n = 2 experiments pooled. (B–D) Analysis of 3 flow cytometry–sorted subsets of Pmel-1 effector (CD44+CD62L–) CD8+CD90.1+ T cells ex vivo cocultured with B16 melanoma cells. (B) ELISA showing cytokine production from supernatants of B16 cocultures either with T cells from spleens (Sp) or TILs of adoptive cell–transferred mice. Mean (±SEM). *P < 0.05, **P < 0.001, and N.S., not significant by unpaired 2-tailed t test. (C) Firefly luciferase–based cytotoxicity assay showing hgp100-specific cytotoxicity of each sorted CX3CR1 subset. Mean (±SEM). *P < 0.05, and **P < 0.01 by unpaired 2-tailed t test. (D) Quantification of mRNA levels on each flow-sorted CX3CR1 subset during the cocultures. Normalization was done with mouse Thy1.1 gene, which is not expressed on B16 cells. Mean (±SEM). *P < 0.05, **P < 0.01, and ***P < 0.005 by 1-way ANOVA with Tukey’s test. (E) Phenotypic analysis of human melanoma CD8+ TILs. Numbers indicate cytokine expression on each subset of CD8+ TILs determined by CX3CR1 expression.

