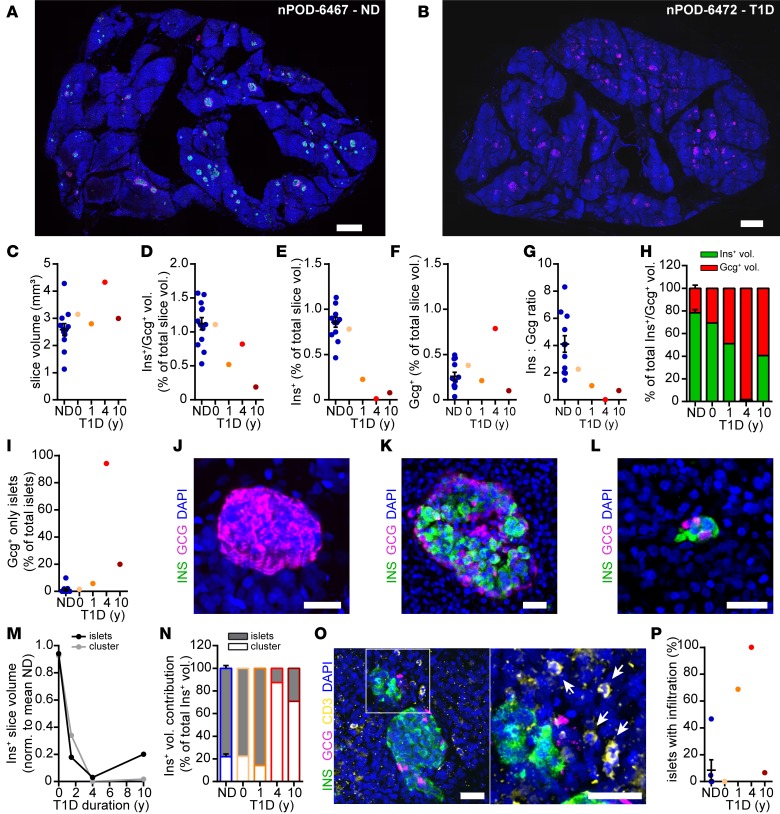
Figure 2. 3D histomorphometric analysis of tissue slices.
(A and B) Maximum intensity projections of human pancreas tissue slices from a nondiabetic donor (A) and a donor with a 4-year history of T1D (B) stained for insulin (green), glucagon (magenta), and DAPI (blue). (C) Total slice volumes analyzed for each donor. (D–F) Quantification of hormone+ volumes as a percentage of the total slice volumes for (D) Ins+/Gcg+ volume, (E) Ins+ volume, and (F) Gcg+ volume. (G) The Ins+/Gcg+ ratio within the slice volume of each individual donor. (H) The contribution of Ins+ and Gcg+ volumes to total endocrine volume of each individual donor. (I) The percentage of islets consisting of only Gcg+ cells. (J) Maximum intensity projection of an islet with only Gcg+ cells. (K and L) Maximum intensity projections of an example islet (K) and small-cell cluster (L). (M) Fractional loss of Ins+ volume in small-cell clusters (≤10 cells) and islets (>10 cells) normalized to ND. (N) Contribution of Ins+ volume in small-cell clusters (≤10 cells) and islets (>10 cells) to total residual Ins+ volume. (O) Maximum intensity projection of an islet in a pancreas tissue slice (donor nPOD-6469, 1.5y T1D) with surrounding CD3+ cells (the area in the white box is shown at high magnification to the right, with arrows indicating CD3+ cells). (P) Islets with infiltration for 3 nondiabetic donors and 4 donors with type 1 diabetes. Scale bars: 500 μm (A and B); 50 μm (J–L); 30 μm (O); data for nondiabetic donors (n = 13) are presented as mean ± SEM.

