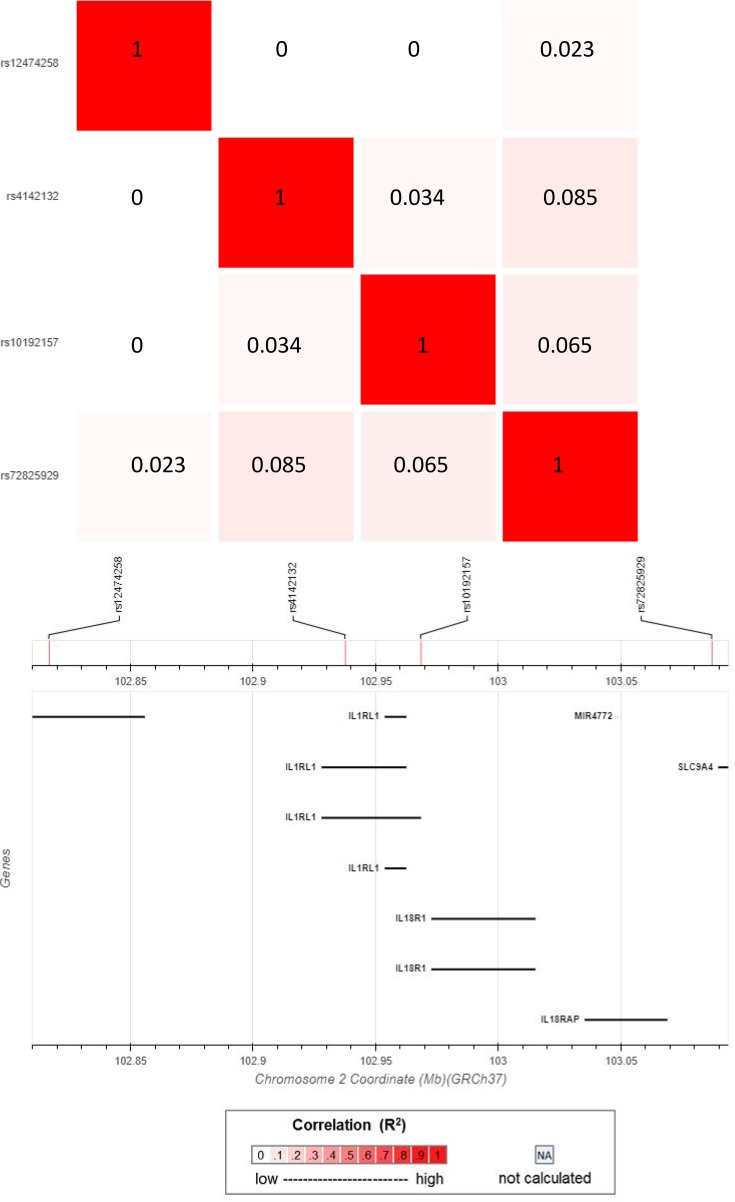
Figure 2. Linkage disequilibrium map of the 4 IL1RL1 variants identified in Stages 1–3 and selected as SNPs for functional study.
Figure identifies the level of linkage disequilibrium between signals identified based on r2 values. Image generated using the EUR population of the Phase I cohort of the 1000 genomes study via the LDmatrix tab of the online software tool LDlink 3.6, available at https://ldlink.nci.nih.gov/

