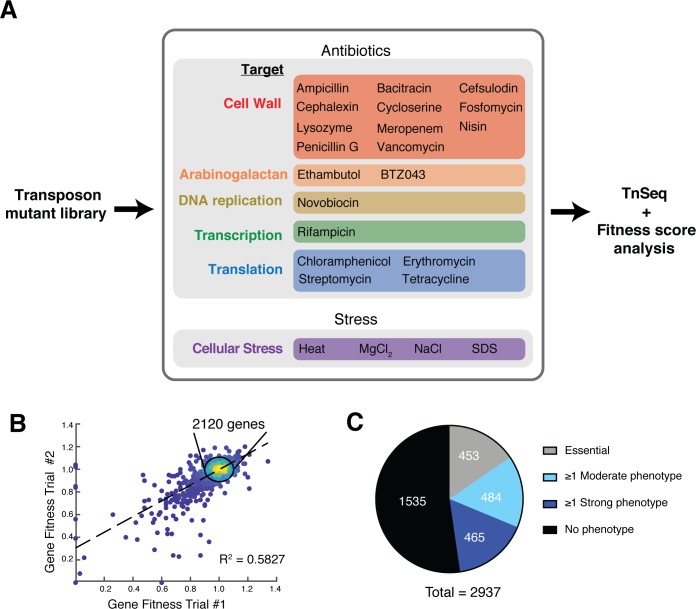
Figure 1. Phenotypic profiling of a Corynebacterium glutamicum transposon mutant library.
(A) Overview of the phenotypic profiling procedure. A transposon mutagenized library of Cglu MB001 was exposed to sub-MIC concentrations of the indicated antibiotics or to the listed stress condition for 11 generations prior to transposon sequencing analysis and the calculation of fitness scores for mutants in each gene under each condition. Several of the antibiotics were tested at two different concentrations such that a total of 40 different growth conditions were surveyed (see Supplementary file 1). (B) Scatterplot highlighting the reproducibility of the analysis for duplicate samples grown in the absence of drug. The calculated fitness scores for each gene in the two replicates are plotted. Scores were calculated by comparing the proportion of total transposon reads for each gene in the untreated samples grown for 11 generations relative to the reads mapped for the input library. (C) Pie chart summarizing results from the profiling analysis. Depicted are essential genes (453, gray), genes that displayed a strong phenotype (fitness value below 0.75 or above 1.25) in at least one condition (465, dark blue), genes that displayed a moderate phenotype (fitness value below 0.9 or above 1.1) in at least one condition (484, light blue) and genes that did not show a phenotype in any condition tested (1535, black).


