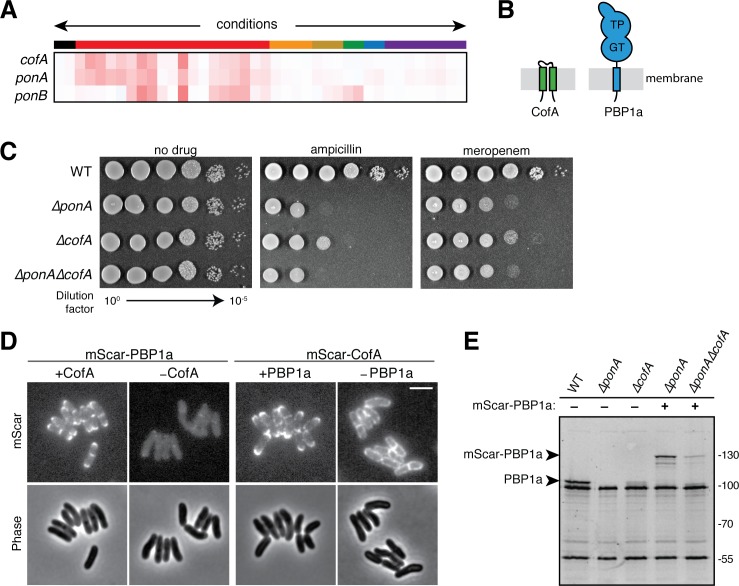
Figure 3. CofA is required for PBP1a accumulation.
(A) Phenotypic profiles of cofA (cgp_0016), ponA (cgp_0336, encoding PBP1a), and ponB (cgp_3313, encoding PBP1b) displayed as in Figure 2. Note that cofA and ponA clustered tightly together in the analysis due to their similar profiles. Neither gene clustered near ponB, which is shown for reference. (B) Schematic showing the predicted membrane topology of CofA and PBP1a. (C) Cultures of wild-type Cglu and the indicated deletion mutants were grown, serially diluted, and plated as in Figure 2—figure supplement 1. The concentration of drugs used was 0.2 μg/mL ampicillin or 0.04 μg/mL meropenem as indicated. (D) Shown are mScarlet fluorescence (upper) and phase contrast (lower) micrographs of cells expressing the indicated fusion protein. Fusions were constitutively expressed from a construct integrated at the attB1 site. Translation of the fusions was controlled by the theophylline (riboE1) riboswitch and was induced with 0.3 mM theophylline in each case. The fusions were produced in strains deleted for the corresponding native untagged protein. Cells from an overnight culture were diluted 1:1000 in BHI supplemented with 0.3 mM theophylline and then imaged on CGX2 agarose pads after growth for 5.5 hr at 30°C. The brightness for the two mScar-PBP1a micrographs is normalized to allow for direct comparison. Bar equals 3 µm. (E) Bocillin labeling of PBPs in wild-type and mutant strains. Overnight cultures of the indicated strains were diluted 1:200 in BHI and grown until they reached an OD600 = 0.3. Cells were then treated with 10 μg/mL Bocillin-FL, and membrane fractions were isolated. Proteins (5 µg total) were then separated on a 10% SDS-PAGE gel and labeled bands were visualized using a Typhoon florescence scanner. Production of the mScar-PBP1a fusions was induced with 0.3 mM theophylline as for the microscopy analysis in panel D. Fluorescent band intensities for labeled PBP1a or mScar-PBP1a were quantified and normalized to the PBP2a band signal running just above 55 kDa. The PBP1a or mScar-PBP1a signal decreased by a factor of 5 in ΔcofA cells relative to the corresponding CofA+ strain.


