. 2020 Apr 8;9:e53357. doi: 10.7554/eLife.53357

Figure 4. The effect of trajectory length on DISC performance.

(a) Computational time (mean ± s.d.) of each algorithm for analyzing single trajectories of varying lengths. The test was performed with an Intel Xeon, 3.50 GHz processor running MATLAB 2017a. (b) Accuracy (mean ± s.d., N = 5000) of DISC for simulated trajectories of a two-state model with varying SNR and total number of data points.

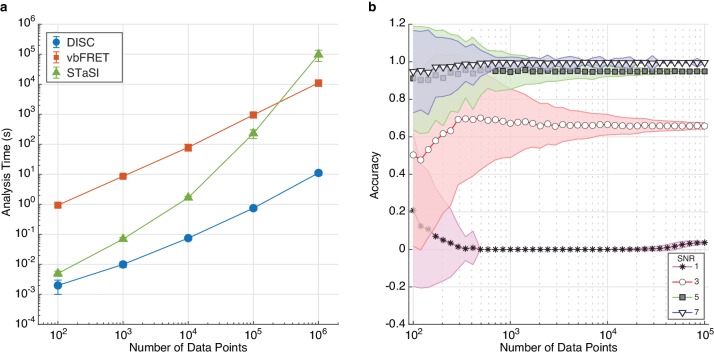
Figure 4—source data 1. Algorithm results across varying trajectory length.

Figure 4.

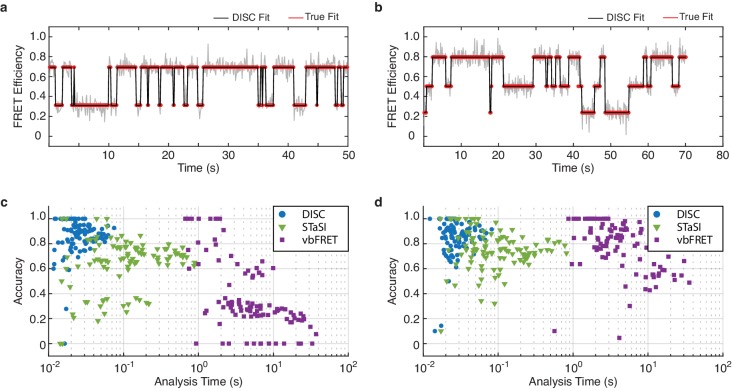
Figure 4—figure supplement 1. Algorithm performance on simulated smFRET data.

Figure 4—figure supplement 1.

(a, b) Representative fits of simulated smFRET data with 2 (a) or 3 (b) states (red) overlaid with the idealized fits from DISC (black). (c, d) Scatter plot of accuracy vs analysis time of 100 simulated smFRET trajectories featuring 2 (c) or 3 (d) states analyzed by DISC (blue circles), STaSI (green triangles) and vbFRET (purple squares).