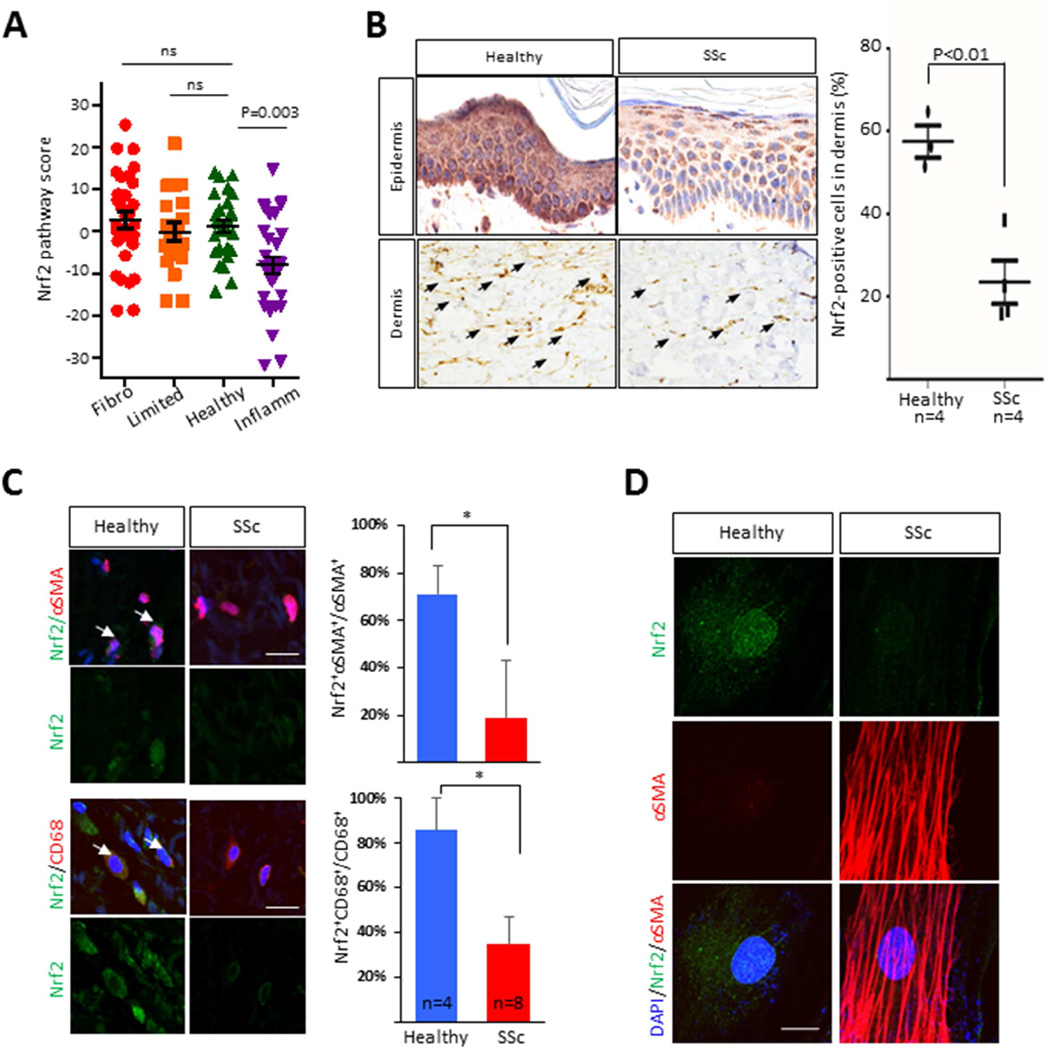
Figure 3. Nrf2 expression and activity is reduced in SSc.
A. Nrf2 pathway scores (defined as described under Material and Methods) queried from a skin biopsy-derived microarray transcriptome dataset [2]. Each symbol represents an individual biopsy. Fibro, fibroproliferative gene subset; Inflamm., inflammatory; Limited, limited. B. Immunohistochemistry of skin biopsies from SSc patients (n=4) and healthy controls (n=3) immunostained with antibodies to Nrf2. Left panels, representative images (magnification 400 ×). Arrows indicate intradermal Nrf2-immunopositive cells. Right panel, quantitation. Results are the mean ± SD in 3 hpf randomly selected from each biopsy. C. Immunofluorescence. Healthy control (n=4) and SSc (n=8) skin biopsies were immunostained with antibodies to αSMA (red), Nrf2 (green) or CD68 (red); nuclei were identified using DAPI (blue). Left panel, representative images; arrowheads indicate double-immunopositive cells. Bar=20 µm. Right panels show the proportion of double-positive cells. Results are mean ± SEM; *p<0.05. D. Double-label immunofluorescence with antibodies to Nrf2 and α-SMA in control (n=3) and SSc (n=3) skin fibroblasts (magnification ×600). Representative images. Green color, Nrf2; Red color, αSMA; blue color, DAPI. Bar=10 µm. α-SMA, alpha smooth muscle actin.

