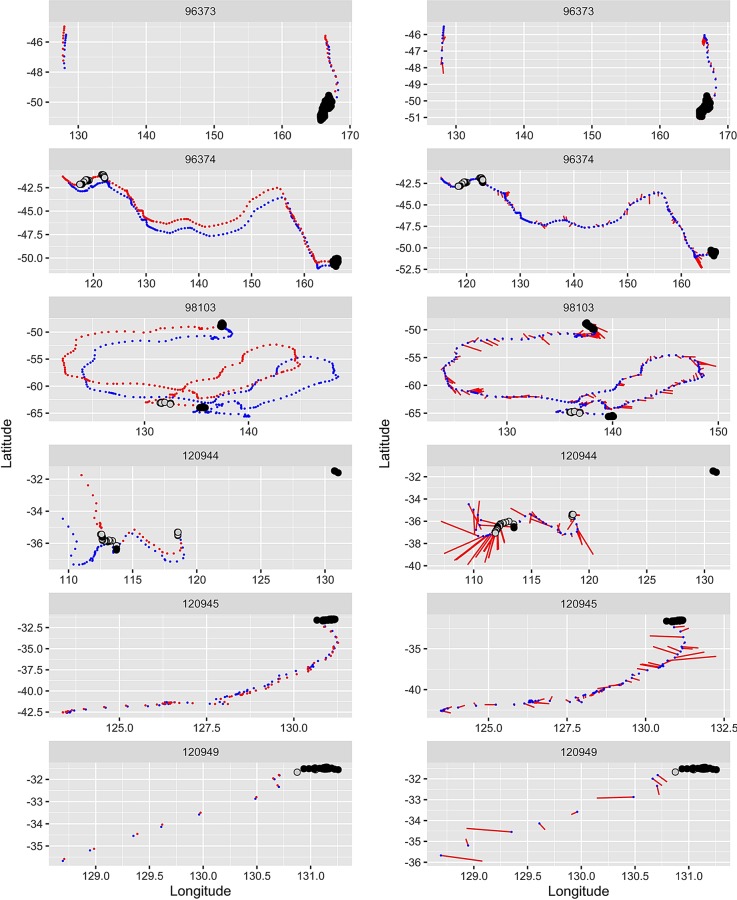
Fig 5. Left plots: Observed trajectories of southern right whales (blue dots) with superimposed surface current vectors (red).
The black and grey dots indicate the estimated and uncertain foraging locations respectively. Right plots: Comparison of the observed (blue) and current-corrected (red) tracks. Foraging locations are positioned on the current-corrected track at the same dates as on the observed track. Note that the current-corrected track displays the animal’s own motion integrated in time but, taken alone, a position along that track bears no direct interpretation.

