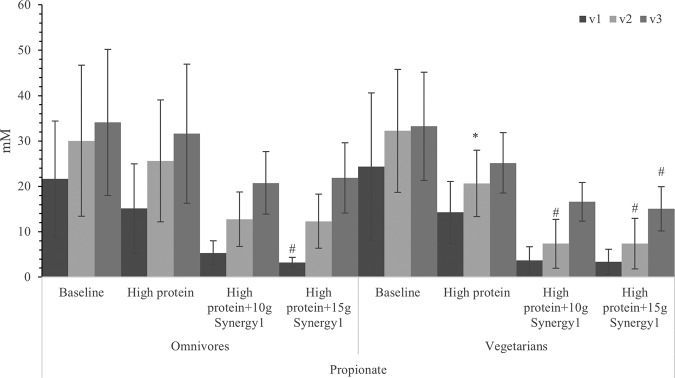
FIG 5.
Propionate concentration in samples with different steady states in three different vessels of a human in vitro colonic model as analyzed by gas chromatography (GC). Values are means over 3 consecutive days from 3 omnivores’ microbiota or 3 vegetarians’ microbiota ± standard deviation. For each measurement, significant differences in each vessel among four steady states are labeled. *, mean values were significantly different from the baseline steady state (P < 0.05). **, mean values were significantly different from the baseline steady state (P < 0.01). ***, mean values were significantly different from the baseline steady state (P < 0.001). #, mean values were significantly different from the high-protein steady state (P < 0.05). ##, mean values were significantly different from the high-protein steady state (P < 0.01). ###, mean values were significantly different from the high-protein steady state (P < 0.001).

