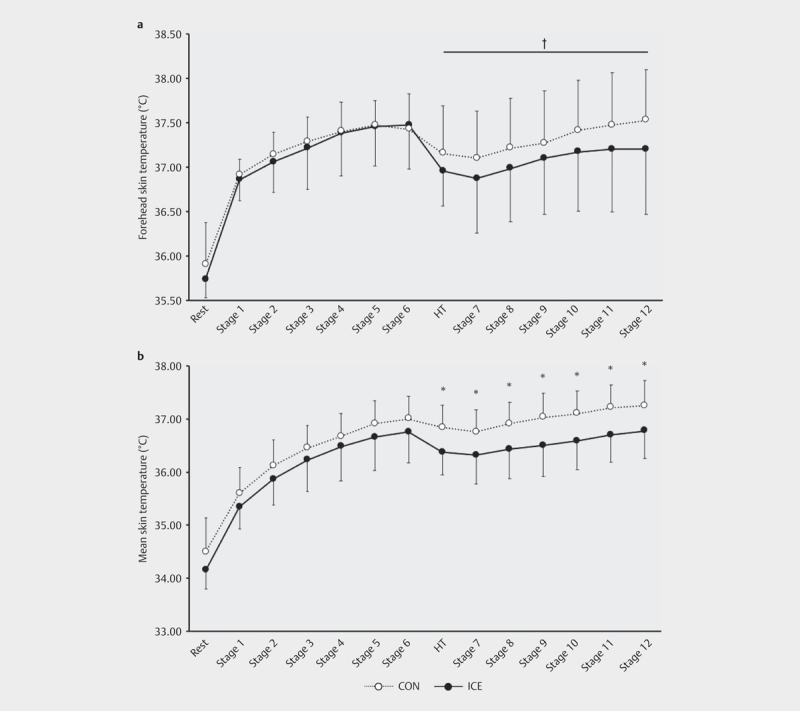
Fig. 3.

The forehead skin temperature a and mean skin temperature b during exercise under the two experimental conditions. The mean values are expressed as mean±SD of seven participants (CON:○, ICE:●). Time × drink effect CON vs. ICE: * P < 0.05 (absolute values), † P < 0.05 (change rate values).
