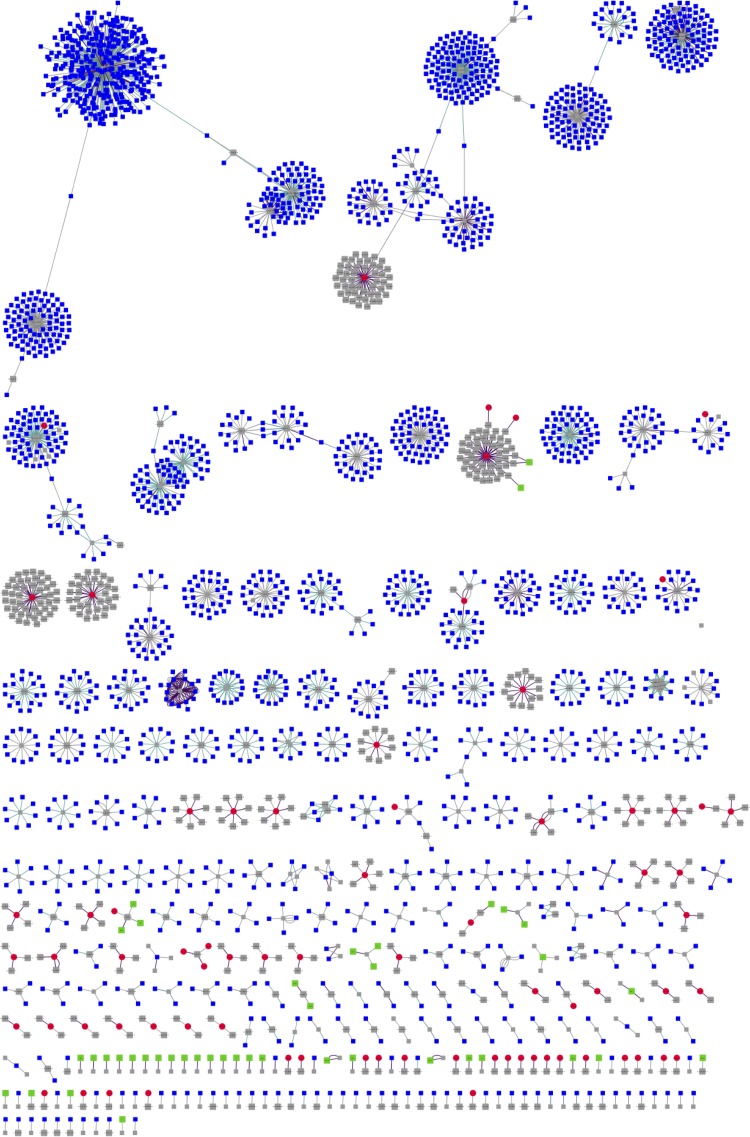
FIG 4.
Network visualization of the relationship between the hypolith virome, CRISPR-spacers, and reference data sets. The nodes in the network are CRISP-R spacers (gray), hypolith metavirome (red), IMG/VR viromes (blue), and Antarctic soil viromes (green). Positive alignments between data sets are represented by the connections (edges) between nodes, with the connection distance being inversely proportional to the alignment strength.

