
Figure 6.
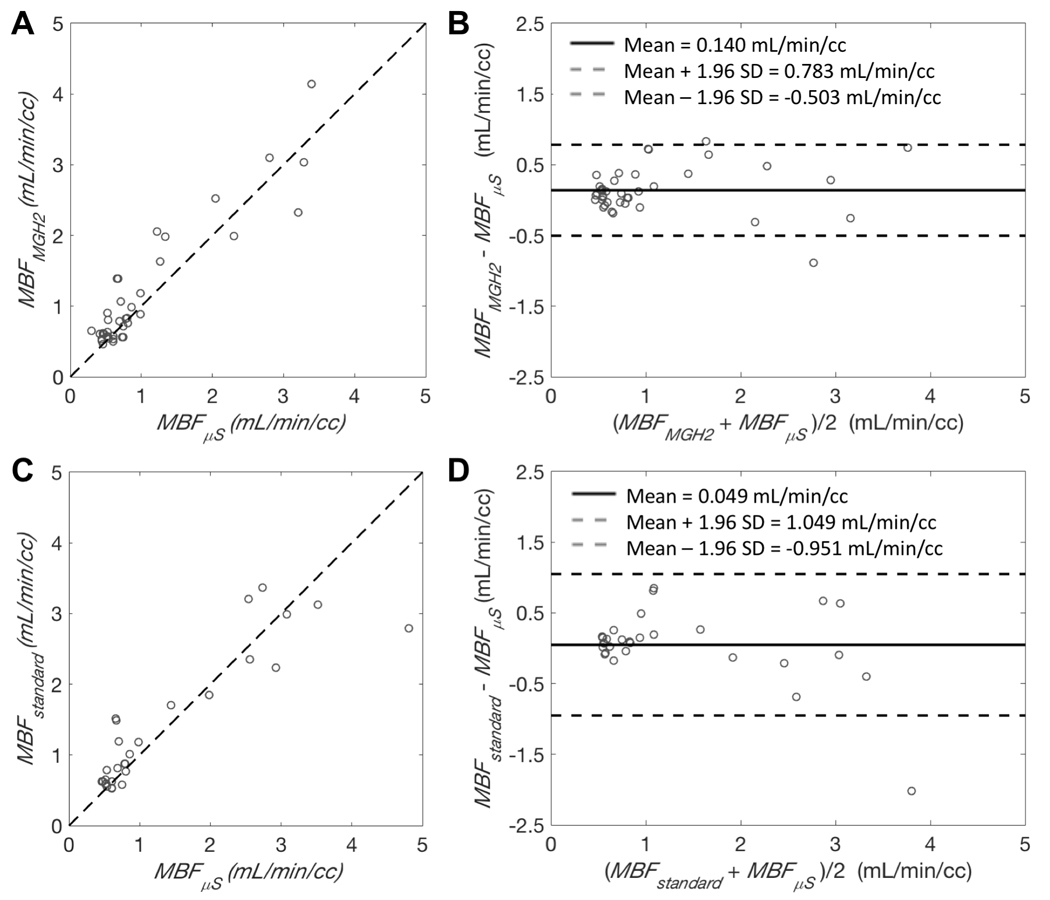
A and C: Scatter plots of the relationship between MBF estimates obtained with PET (MBFMGH2 or MBFstandard) and MBF estimates (MBFμS) obtained from microspheres. Dashed lines are lines of identity. B and D: Bland-Altman plots showing the agreement between the two methods. Bold line is the mean difference and dashed lines are mean difference ± 1.96 standard deviations. A and B show the comparison between MGH2 and microsphere measurements. C and D show the comparison between the standard method and microsphere measurements. Data points represent results averaged by coronary territories. Microspheres flows were obtained from a total of 16 different injections in 4 different pigs: A and B result from 13 injections, C and D result from 10 injections.