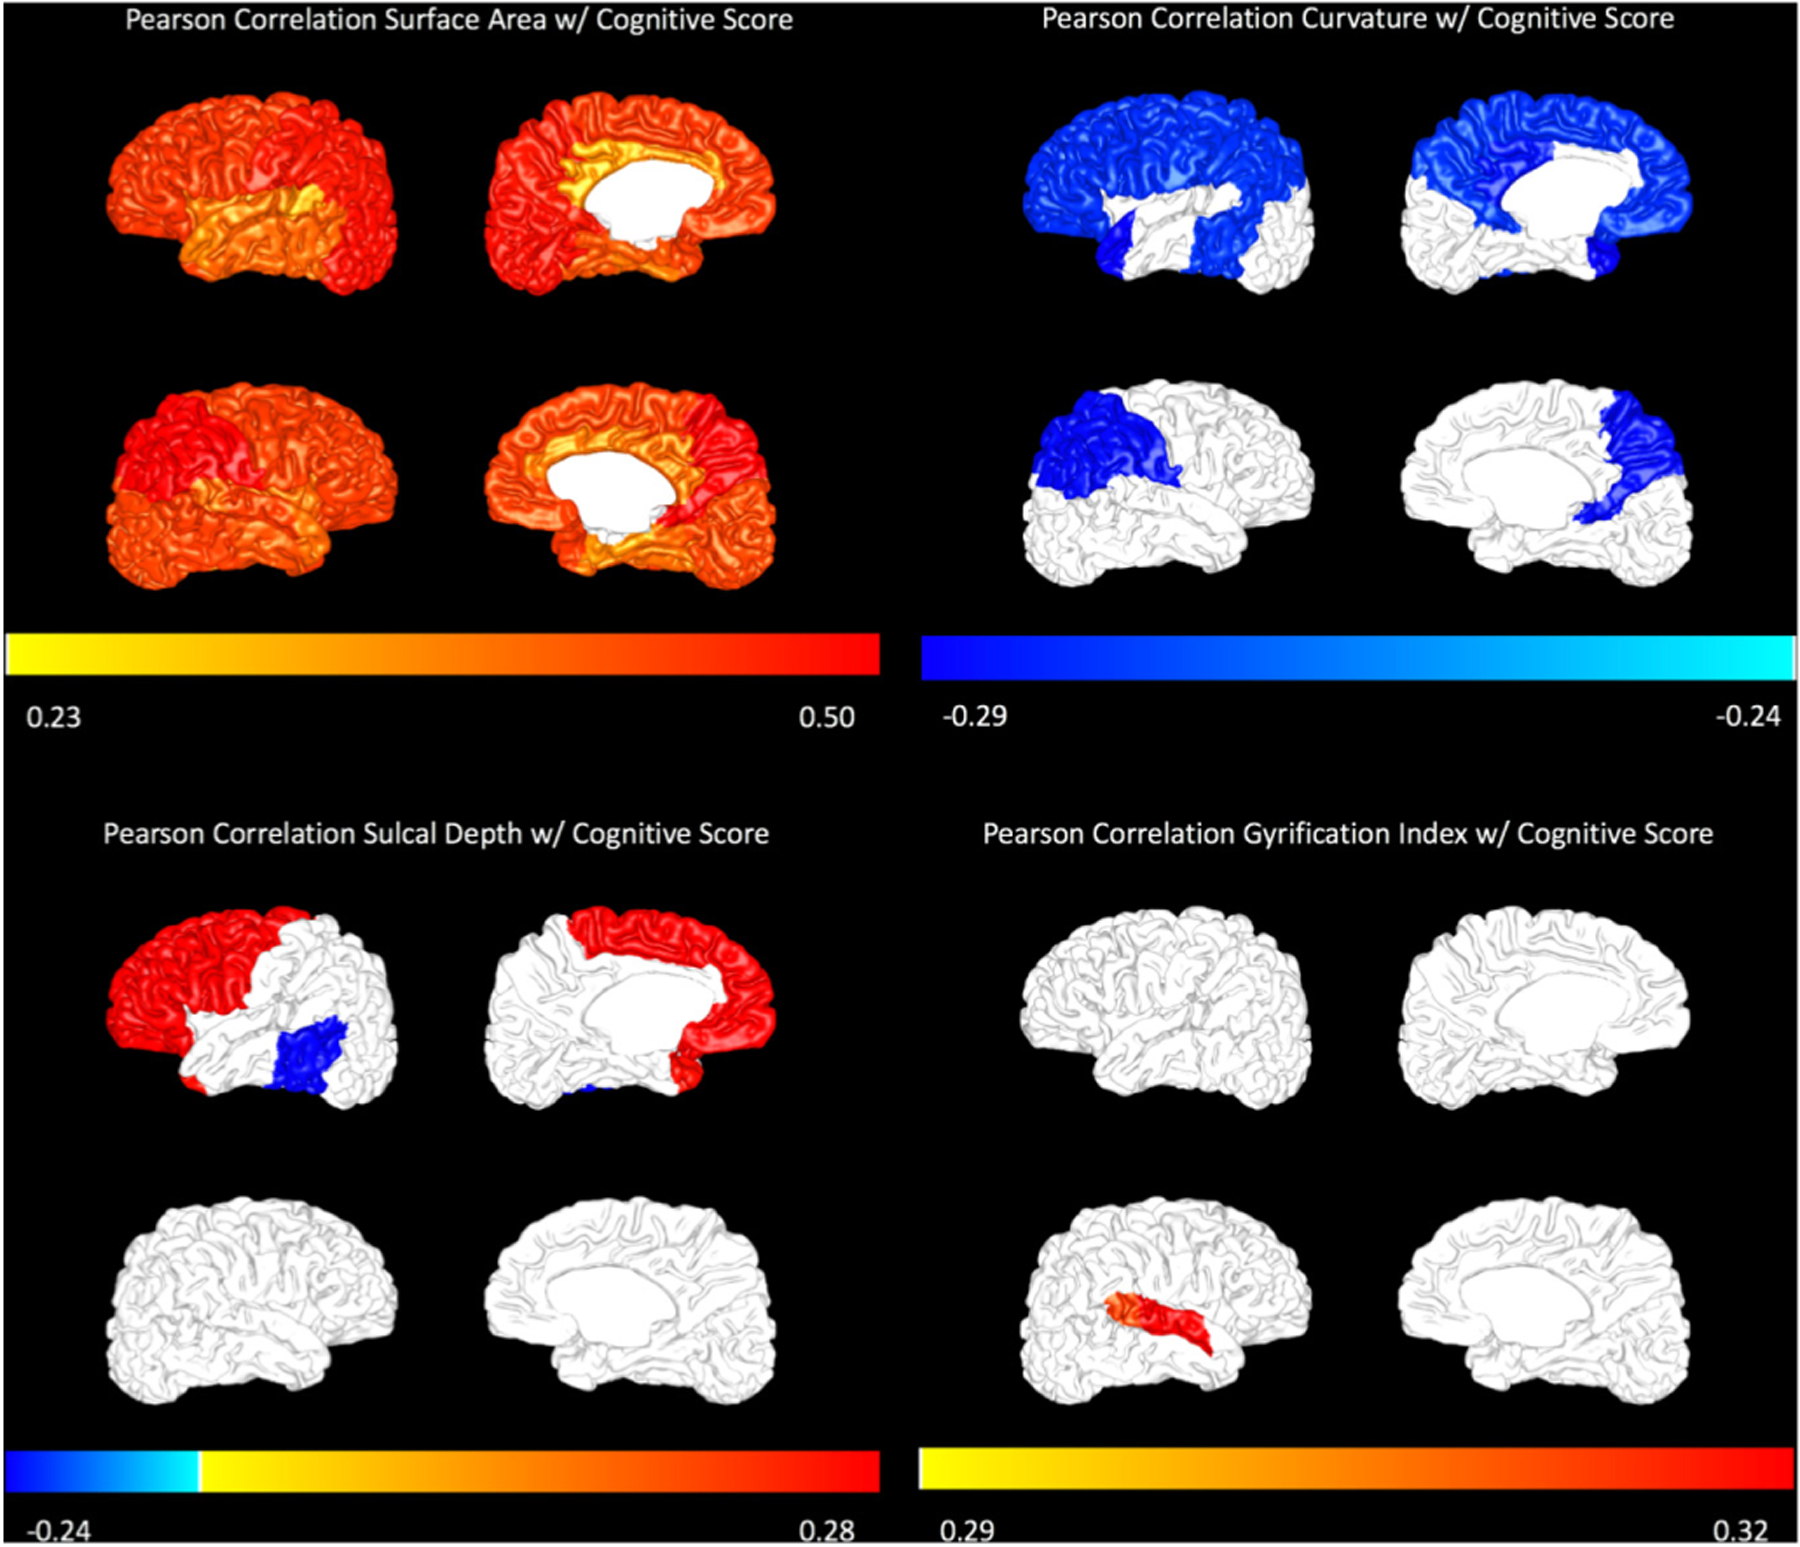
Figure 1.

Pearson correlations with Bayley-III cognitive score are displayed for surface area (top left), curvature (top right), sulcal depth (bottom left) and gyrification index (bottom right) on a representative subject brain. The magnitude of correlation is displayed only for regions that were significant at p<0.05. The colour bar represents the magnitude of the Pearson correlation (R value).
