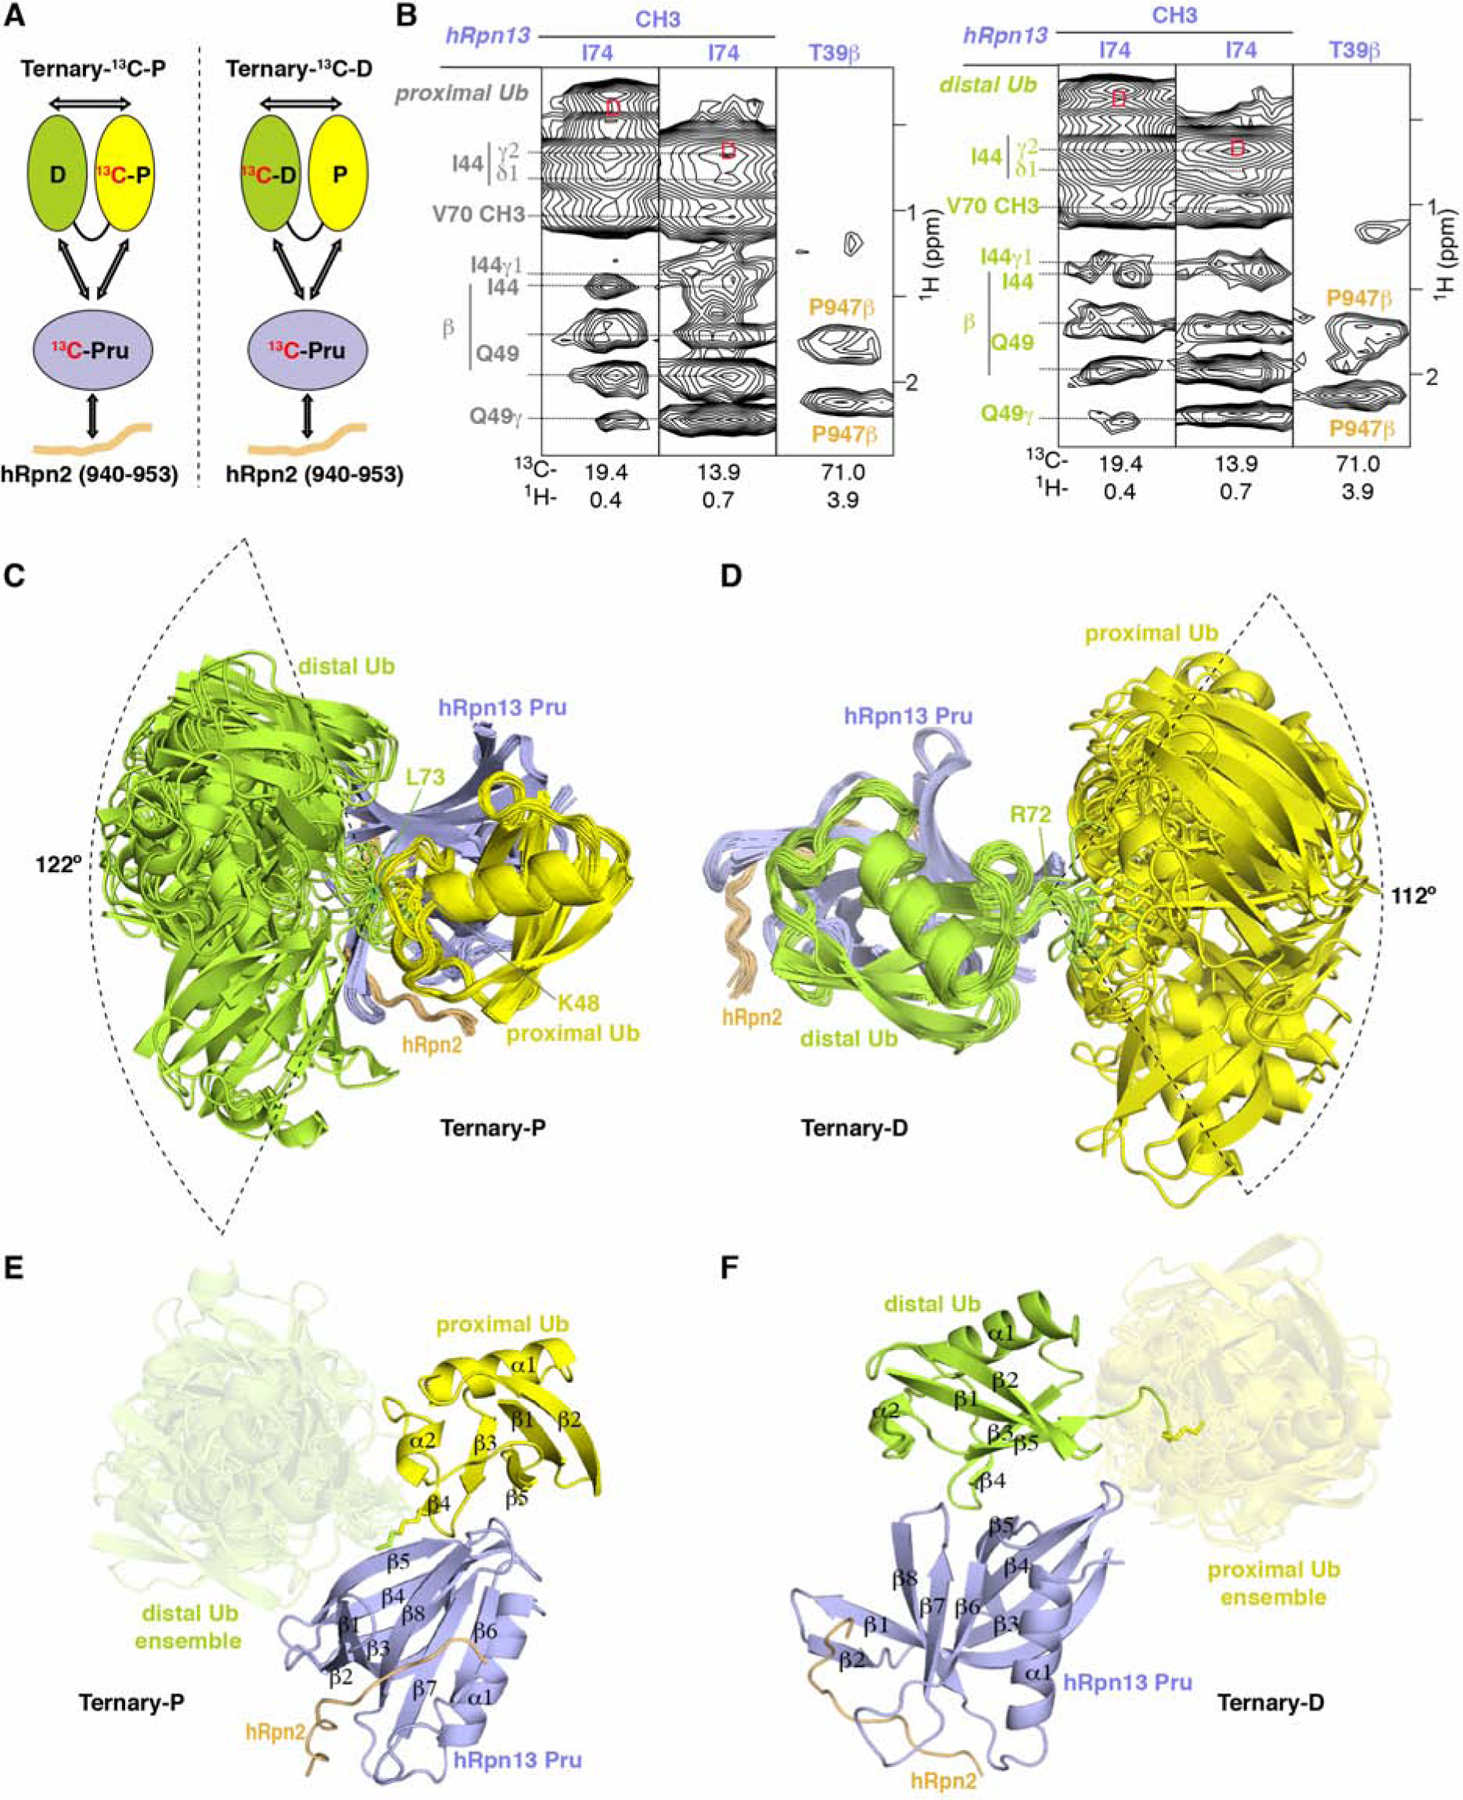
Figure 1. Structure of hRpn2-bound hRpn13 with K48-diubiquitin.

(A) Schematic representation of interactions (arrows) detected in 13C-edited NOESY spectra recorded on two differentially labeled samples at 25°C and pH 6.5; Ternary- 13C-P (0.6 mM 13C-hRpn13 Pru (purple), 0.6 mM hRpn2 (940–953, orange) and 0.72 mM K48-diubiquitin with 13C-proximal ubiquitin (yellow)) and Ternary-13C-D (0.6 mM 13C-hRpn13 Pru, 0.6 mM hRpn2 (940–953) and 0.72 mM K48-diubiquitin with 13C-distal ubiquitin (green)). The ubiquitin linker region is displayed as a black connecting curve. 13C-labeled constituents are indicated with “13C” in red.
(B) Selected regions highlighting intermolecular NOE interactions detected in 13C-half-filtered NOESY experiments (100 ms mixing time) acquired on sample Ternary-13C-D (left) or Ternary-13C-P (right), as indicated in (A). Breakthrough signals at the diagonal are labeled by the letter D (red) while assignments for hRpn13 Pru (purple), hRpn2 (orange), proximal ubiquitin (gray) or distal ubiquitin (green) are provided.
(C and D) Ribbon diagram representation for the 15 lowest energy structures without violations for Ternary-P (C) or Ternary-D (D) colored as in (A) with hRpn13 Pru, hRpn2, and the bound ubiquitin superimposed.
(E and F) Ribbon diagram of a representative structure for Ternary-P (E) or Ternary-D (F) selected from the bundles shown in (C) or (D) respectively retaining for the unbound ubiquitin the full conformational ensemble present in (C) and (D) respectively. Secondary structural elements are labeled and the unbound ubiquitins are displayed in a transparent view. See also Figures S1 and S2.
