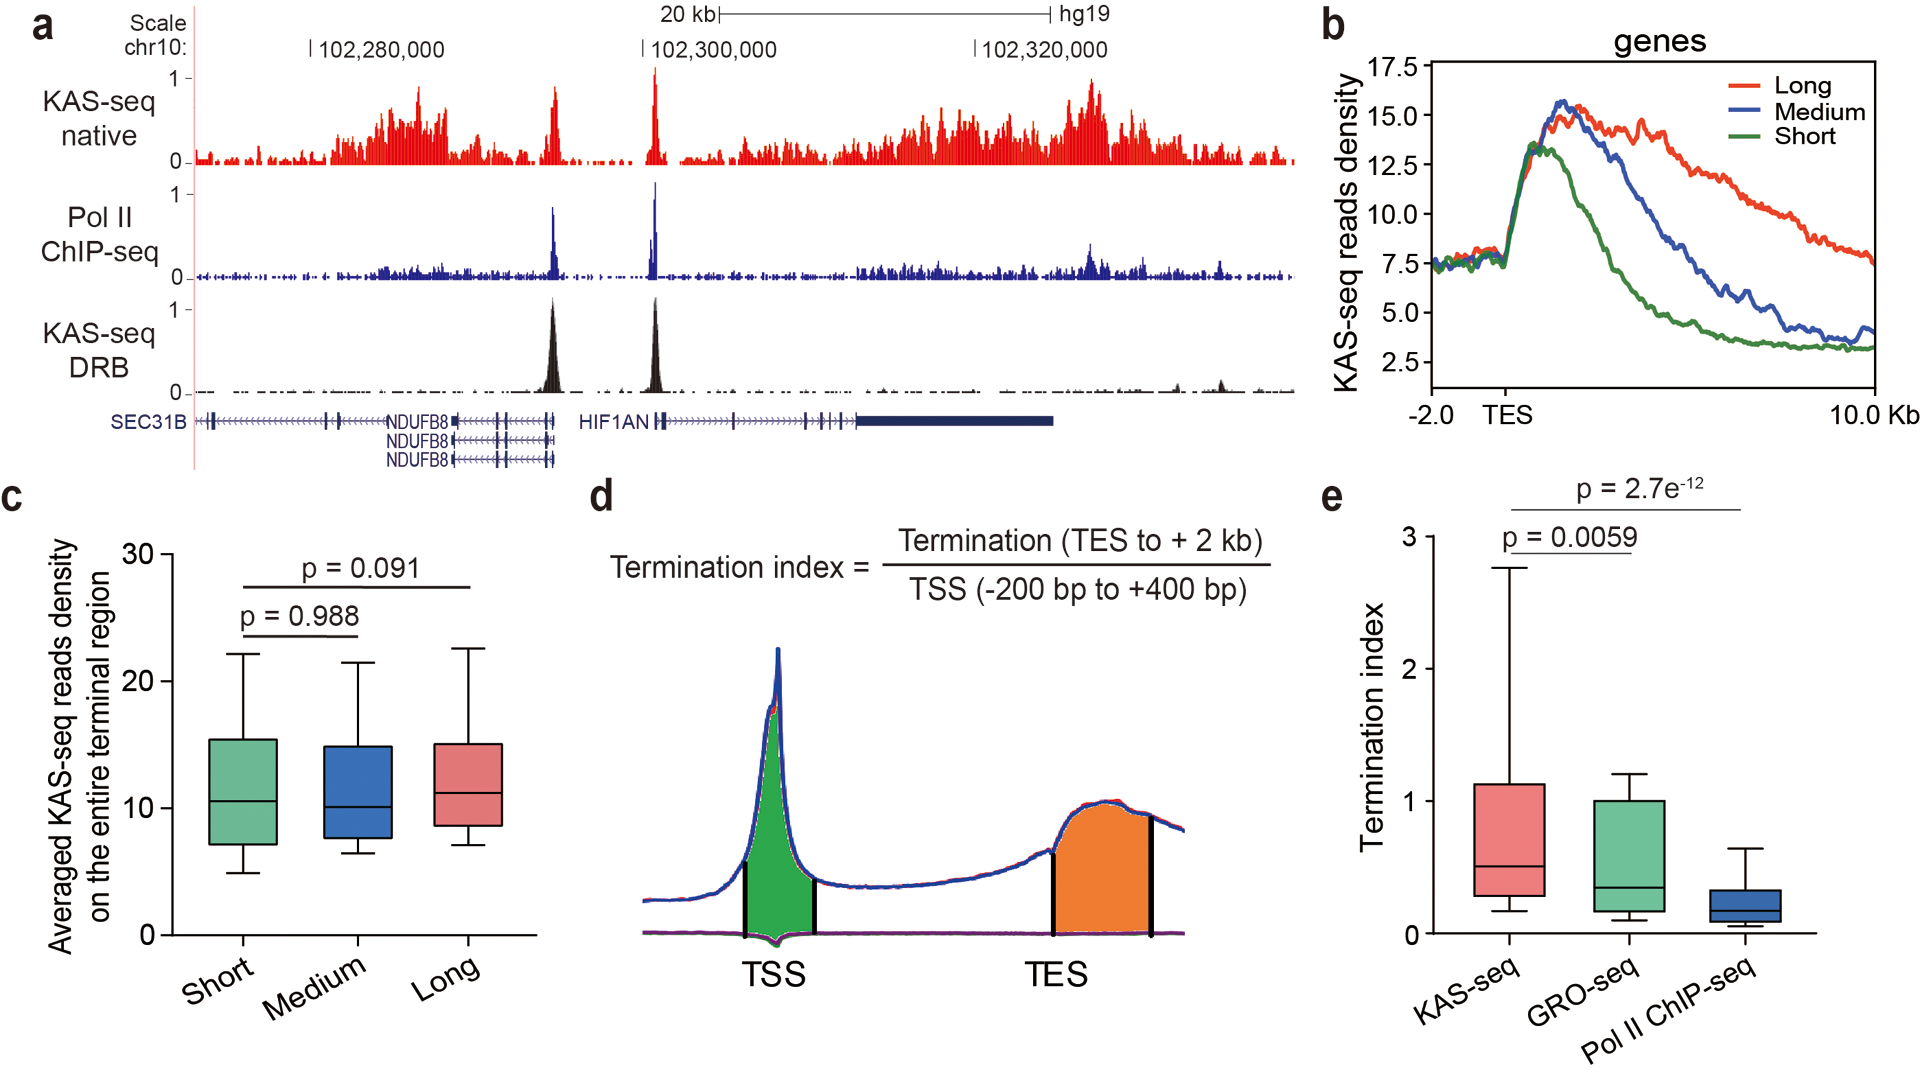
Extended Data Fig. 5. KAS-seq shows no significant length-dependent bias and yields strong signals around TES regions.

a, A snapshot from UCSC Genome Browser showing KAS-seq and Pol II ChIP-seq profiles at the native state, and KAS-seq profile at the DRB-treated state, indicating that KAS-seq signals around TES are derived from Pol II. Autoscale setting is used for all tracks. b, KAS-seq reads densities of three groups of genes with different lengths of termination signals. c, Averaged KAS-seq reads density in the entire terminal regions in the three groups of genes defined in (b). n = 660 genes for all three groups. d, Termination index for each gene was calculated as the ratio of KAS-seq reads density on TES to its downstream 2 kb region, versus reads density on the – 200 bp to +400 bp region around TSS. e, The distribution of termination index for all genes in KAS-seq, GRO-seq, and Pol II ChIP-seq (n = 29,160 genes). For c and e, 10 – 90 percentile of data points are shown, with the center line showing the median, and the box limits showing the upper and lower quartiles. P values were calculated using two-sided unpaired Student’s t-test.
