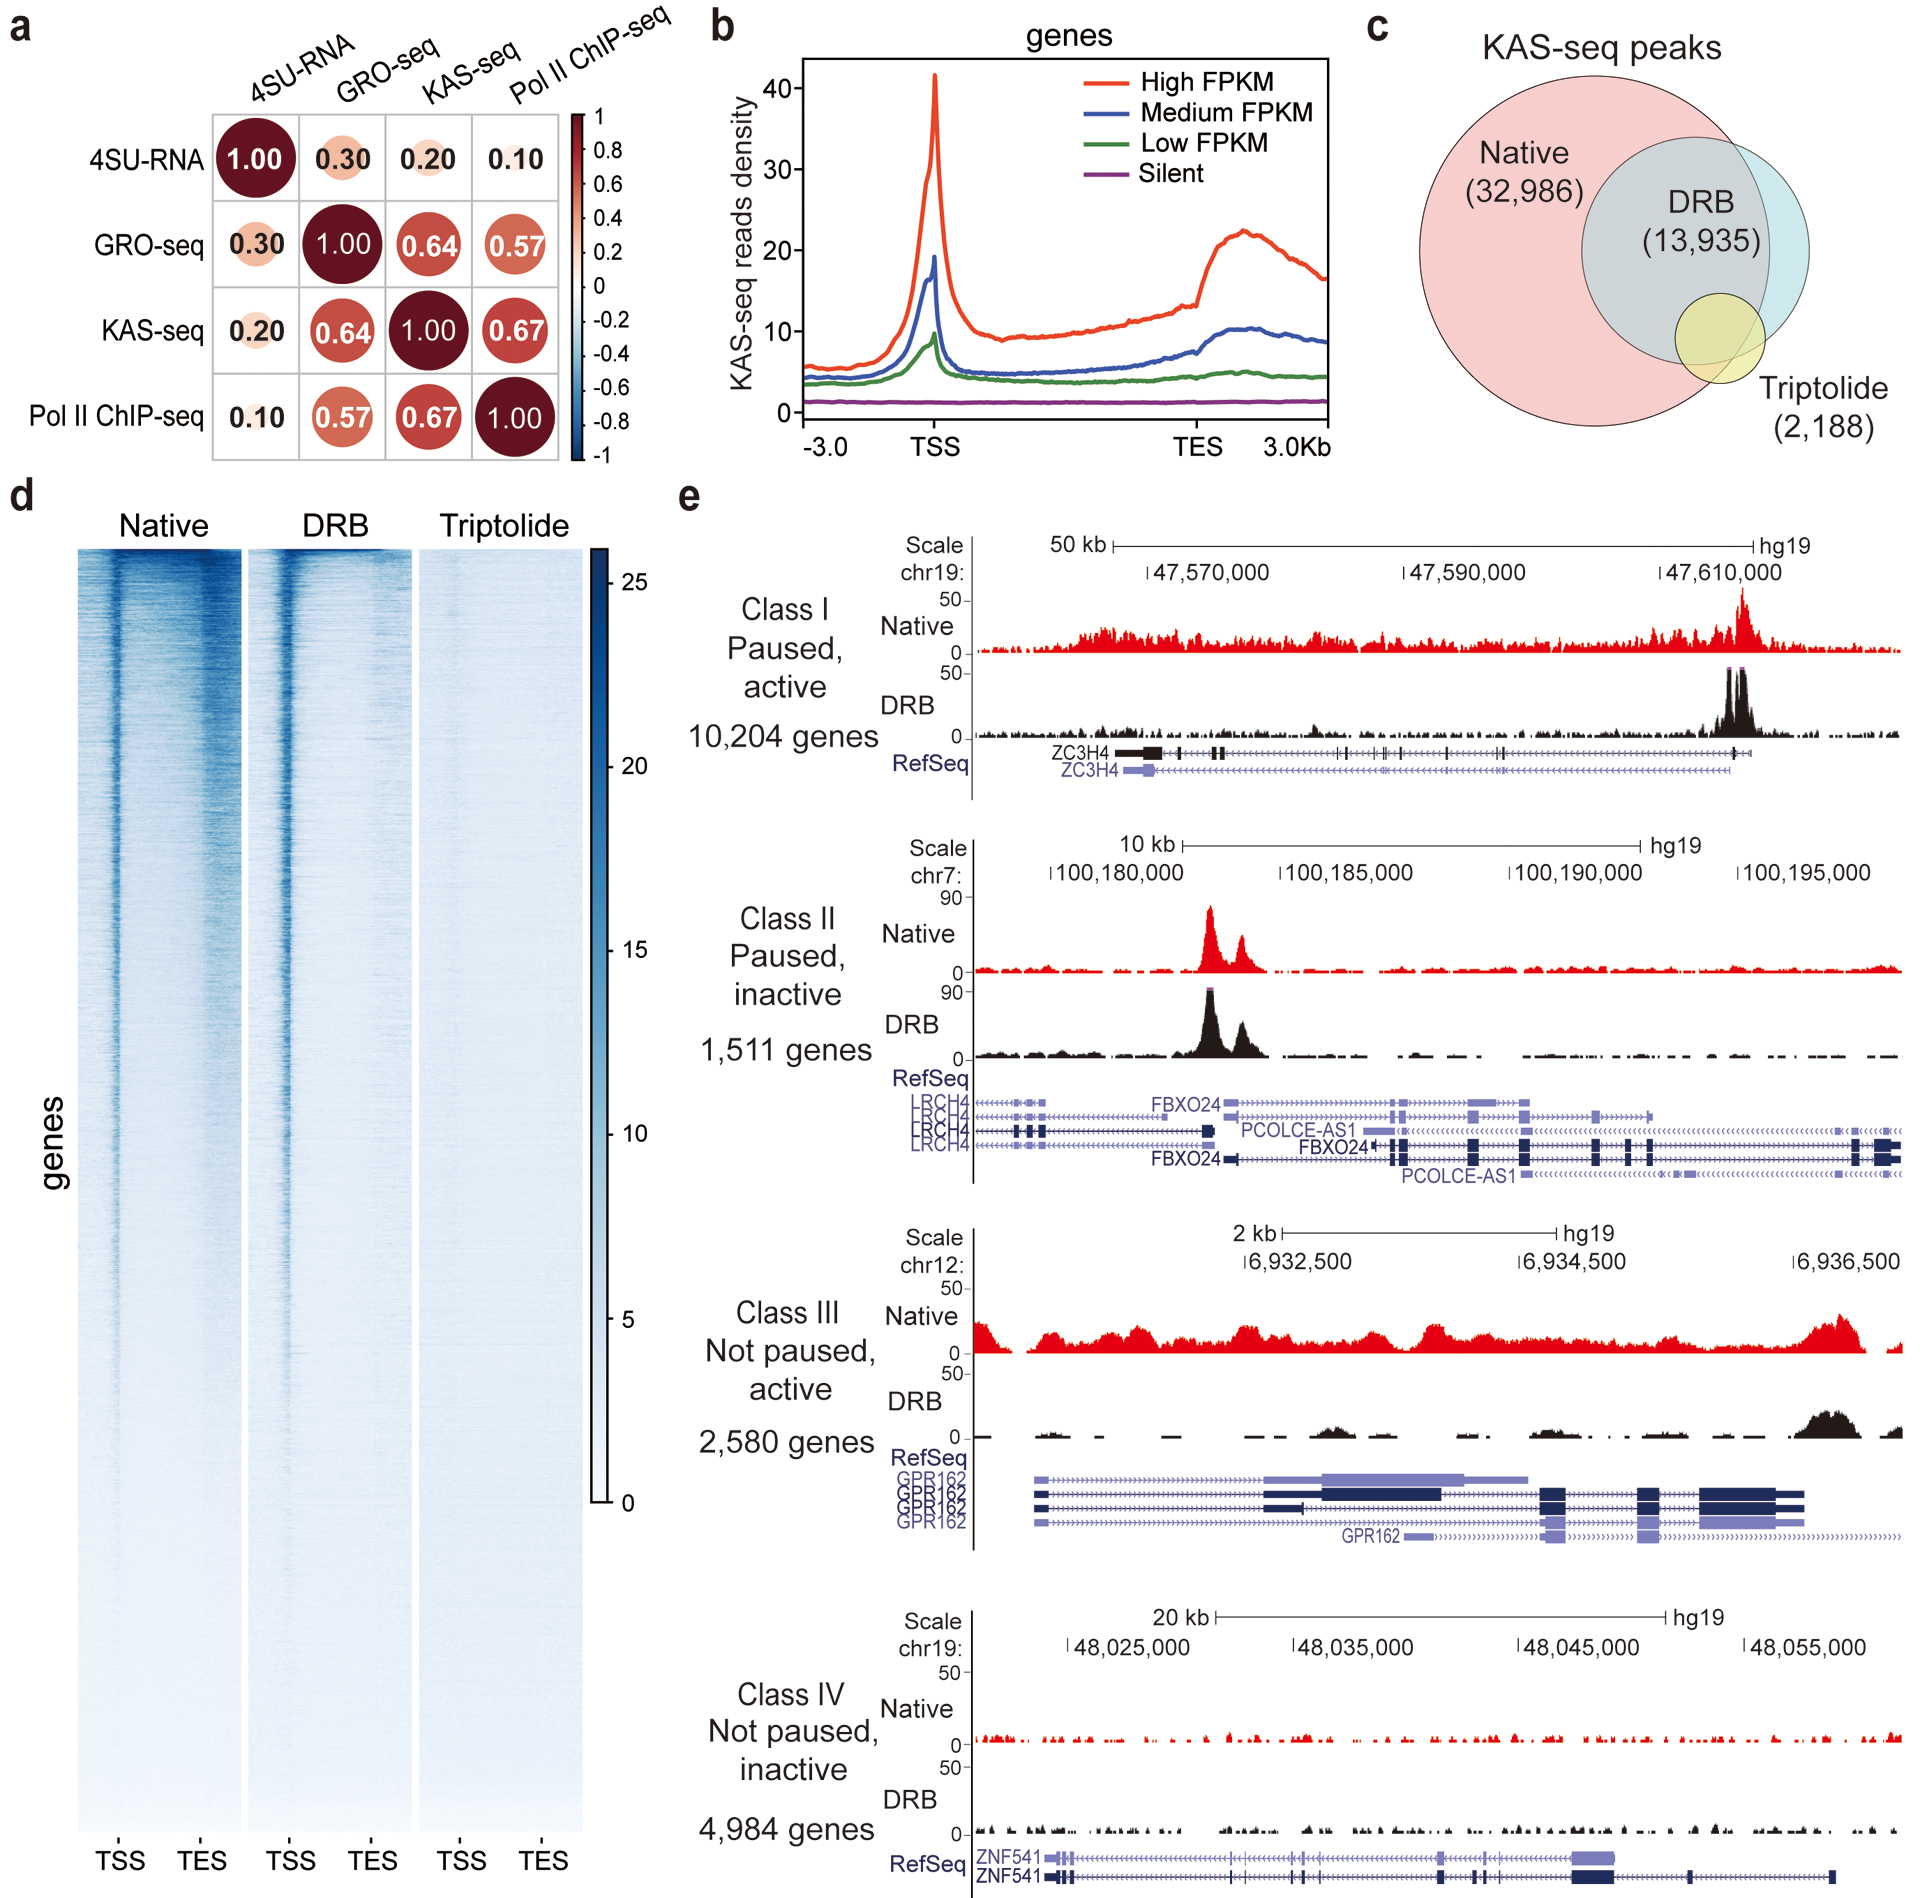
Fig. 3 |. KAS-seq reveals Pol II dynamics and defines gene transcription states.

a, Genome-wide Pearson correlation heatmap between KAS-seq, Pol II ChIP-seq, GRO-seq, and nascent RNA-seq (4SU-seq) reads density on gene-coding regions in HEK293T cells. Pairwise correlation coefficients are noted in each square (n = 839,684 1 kb bins in the hg19 genome). b, KAS-seq reads density at gene-coding regions of genes with different expression levels (defined by RNA-seq) in HEK293T cells. c, Venn diagram showing overlap of KAS-seq peaks in HEK293T cells under native, DRB treatment, and triptolide treatment conditions. The number of common peaks between two replicates was used in each case. d, Heatmap showing KAS-seq signal distribution at gene-coding regions under native, DRB treatment, and triptolide treatment conditions. Regions of 3 kb upstream of TSS and 3 kb downstream of TES were shown. e, Defining four groups of genes with different transcription states based on KAS-seq results. In each group, one gene is shown as an example by using the snapshot of KAS-seq signals under native and DRB-treated conditions.
